Superset is the BI tool that wins on paper and bruises you in production. It is open source, has a serious chart library, and connects to almost anything that speaks SQL. It also assumes you have a platform engineer who is willing to read Helm values files at midnight. Both halves of that picture are real, and both are worth understanding before you commit.
In This Article
I have shipped Superset to enough teams to have a worked opinion. This is the honest version of it: what the tool is in 2026, where it earns the spot, where it costs you, and how to decide between Superset and the alternatives without listening to anyone’s roadmap pitch.
What Superset actually is, in one paragraph
Apache Superset is a Flask web app that sits between a browser and your warehouse. It lets analysts run SQL, build saved charts on top of those queries, and arrange charts onto dashboards. It can also do alerting, scheduled reports, role-based access, and a handful of more advanced things that mostly work. It is open source under Apache 2.0 license, has a mature managed offering through Preset, and a 4.x release line that landed across 2024 and 2025 with a noticeable jump in usability.
The thing Superset is genuinely good at is the analyst workflow. SQL Lab is one of the better SQL editors I have used in any BI tool. The chart variety is wide and the chart configuration is deep without being baroque. Dashboard layout has improved enormously since the 1.x days.
The thing Superset is not is a self-serve tool for non-technical users. The marketing copy has wavered on this point over the years; the working assumption inside any team that ships it should not waver. Stakeholders consume dashboards built by analysts. Analysts build dashboards using SQL. Pretending otherwise will produce wrong numbers.
Architecture, briefly
Superset is more pieces than its UI suggests, and the pieces matter when you have to operate it.
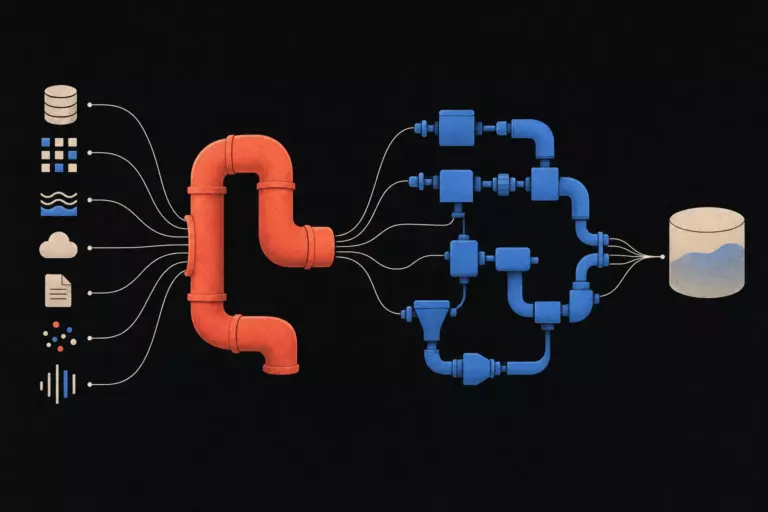
The frontend is a React app served by the Flask backend. The backend talks to a metadata database (Postgres in any real deployment; SQLite only for trying it on a laptop) where it keeps users, saved charts, dashboards, and access rules. Query execution goes through SQLAlchemy to the actual data warehouse: Snowflake, BigQuery, Postgres, ClickHouse, Trino, anything with a SQLAlchemy dialect. A Celery worker handles asynchronous jobs: long queries, alerts, scheduled email and Slack reports. A Redis instance backs the cache layer and the Celery broker.
That is five processes in a production deployment: web, worker, beat scheduler, Redis, Postgres. Each can fail independently. None of them are exotic, but together they are more operational surface than a single-binary tool like Metabase.
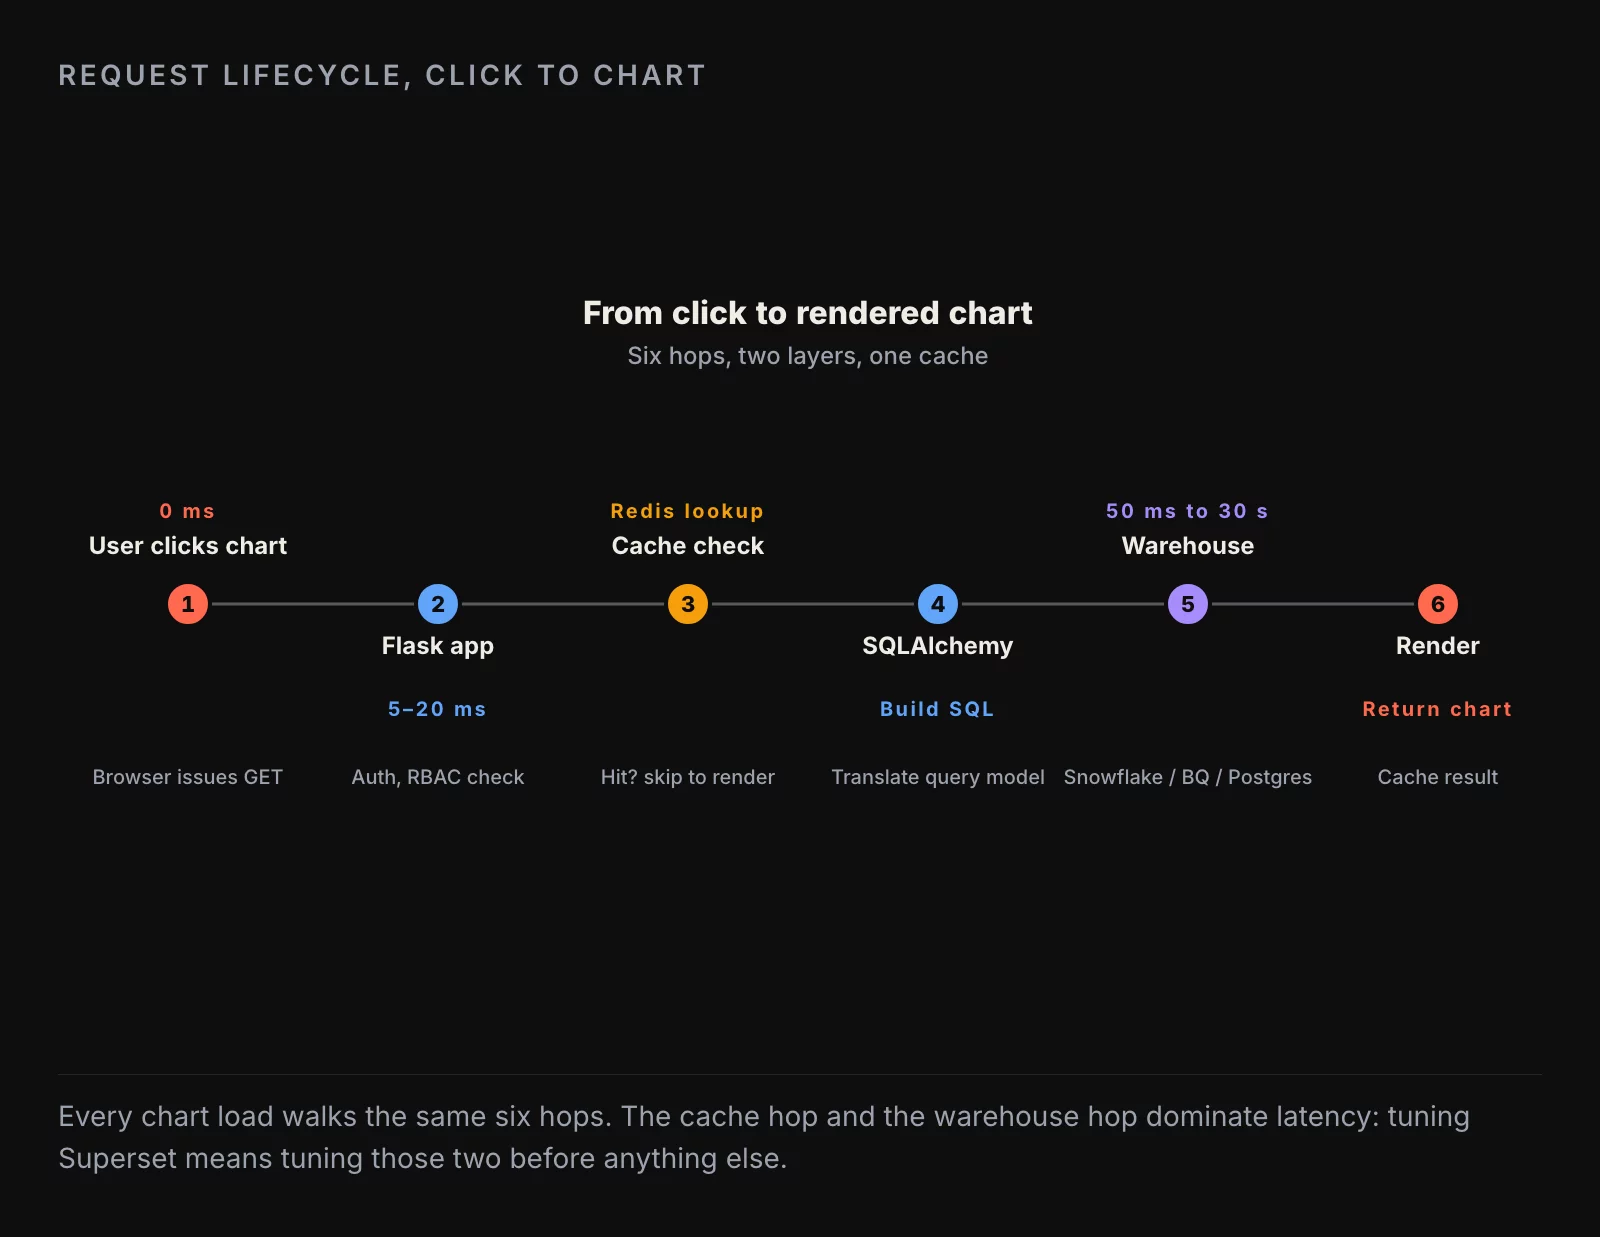
The single most useful mental model is to trace one chart load through this stack. A user opens a dashboard. The browser hits Flask, which checks the user’s role in metadata Postgres. For each chart on the dashboard, Flask checks Redis cache; on miss, it generates SQL through SQLAlchemy and hits the warehouse. Result comes back, gets cached, gets shipped to the browser. The warehouse is where the time goes. The cache is where most of your optimization work pays off. Everything else is plumbing.
What it does well
A few things Superset is genuinely top-of-class at, and a few it has gotten meaningfully better at since 2023.
SQL Lab. The query editor inside Superset is the closest thing in any open-source BI tool to a real database GUI. Multi-tab editing, query history, save-as-chart in one click, syntax-aware autocomplete that knows your schema, scheduled query runs. Analysts who write SQL all day are productive in SQL Lab within an hour.
Chart breadth. Superset ships somewhere north of fifty chart types out of the box, including geospatial ones (Deck.gl, Mapbox) that most BI tools either skip or hide behind an enterprise license. The chart configuration UI is dense, but it is dense in the way a professional tool is dense, not in the way a misdesigned tool is dense.
Dashboard composition. The dashboard editor in Superset 4.x is genuinely good. Drag-to-resize, native filter components that propagate across charts without per-chart wiring, tabbed dashboards, row-level filtering. The 1.x version of this story was painful; the 2026 version is not.
SQL-first modeling. “Datasets” in Superset are saved SQL queries with light metadata: column types, descriptions, default aggregations. They are not a full semantic layer, but they are enough to keep questions referencing a consistent definition without requiring a separate tool. Combined with dbt feeding the underlying tables, the modeling story holds up for teams up to mid-sized.
Embedding. Superset has a native embedded SDK that works. It is not a five-line drop-in; you wire up signed JWTs and set up CORS, but it works and it scales. For internal customer portals, the embedded story is competitive.
Where the friction lives
The corresponding list of things that will cost you time.
Row-level security. Superset has RLS, but it is implemented as WHERE-clause injection on a per-dataset basis. You configure the rules in the UI, the rules apply at query time, and most of the time it works. The edge cases (a user belonging to multiple roles with overlapping rules, a dataset that joins across two tables with different access patterns) require careful schema design upfront. If your RBAC story is “department managers see only their department,” Superset handles it. If your RBAC story is “this customer sees only their own data inside a customer-facing portal,” you will spend a sprint getting it right.
Alerting and scheduled reports. Both exist, both work, both have rough edges. Email alerts fire reliably; Slack alerts fire reliably; PDF report generation occasionally produces the wrong layout on a chart that uses a custom CSS rule. The fix is usually to standardize on one or two chart types for scheduled output and tolerate that creative chart configurations may not render perfectly in the email digest.
Ops cost. This is the big one. A single-node Superset that serves ten analysts is one Docker Compose file and an evening of setup. A multi-tenant Superset that serves two hundred users with Okta SSO, RLS across five datasets, and scheduled reports going to Slack is a real platform deployment. You will need someone who is comfortable reading Helm values files, understanding Celery backpressure, sizing the Redis instance, and rotating SSO certs without a forty-minute outage. Budget for that person before you commit to Superset, not after.
Mobile. Superset dashboards on a phone screen are usable, not pleasant. If your stakeholders consume reports primarily on mobile, this is a strike. None of the open-source BI tools are great at mobile; Superset is roughly in the middle of that pack.

Mapped onto a value-vs-ease matrix, the picture is clear. SQL Lab, chart variety, and dashboard composition sit in the upper right: high value, low friction. RLS, alerting, and mobile sit in the lower left: lower value or higher friction depending on your use case. The lower right is the interesting quadrant: embedding and ops cost are both high value and high friction. That is where most of your platform-engineering time will go, and that is the part that pays back if you are running multi-tenant analytics for paying customers.
Deployment options, honestly
Three paths in 2026. Pick the one that matches the team you have, not the team you wish you had.
Docker Compose, single node. The right answer for trying Superset and for running it for a small internal team (up to roughly twenty users with light load). Stand it up in an afternoon, point it at your warehouse, run for a year on a single VM. Cost is the VM and your time. Risk is operational: backups, patching, certificate rotation are on you.
Helm chart on Kubernetes. The right answer for serious internal deployments at companies that already run Kubernetes. The official Helm chart works; the Bitnami chart is closer to production-ready out of the box. You will tune values files, you will configure persistent volumes for the metadata database, you will tune Celery worker counts. You will also have horizontal scaling, rolling upgrades, and a real disaster-recovery story. Cost is engineering time. Risk is the same as any Kubernetes deployment: complexity stays high once you commit.
Preset (managed Superset). The right answer if you do not have a platform engineer and you want Superset’s analyst experience without the ops burden. Preset is the company founded by the original Superset creator; the product is hosted Superset with SSO, embedding, governance, and support included. Pricing starts in the low four figures per month for serious team sizes and goes up from there. The trade-off is a vendor relationship and a per-user cost. If you are at 30+ users and would otherwise need to hire half a platform engineer, the math usually favors Preset.
How to decide
The decision rule I use across client engagements:
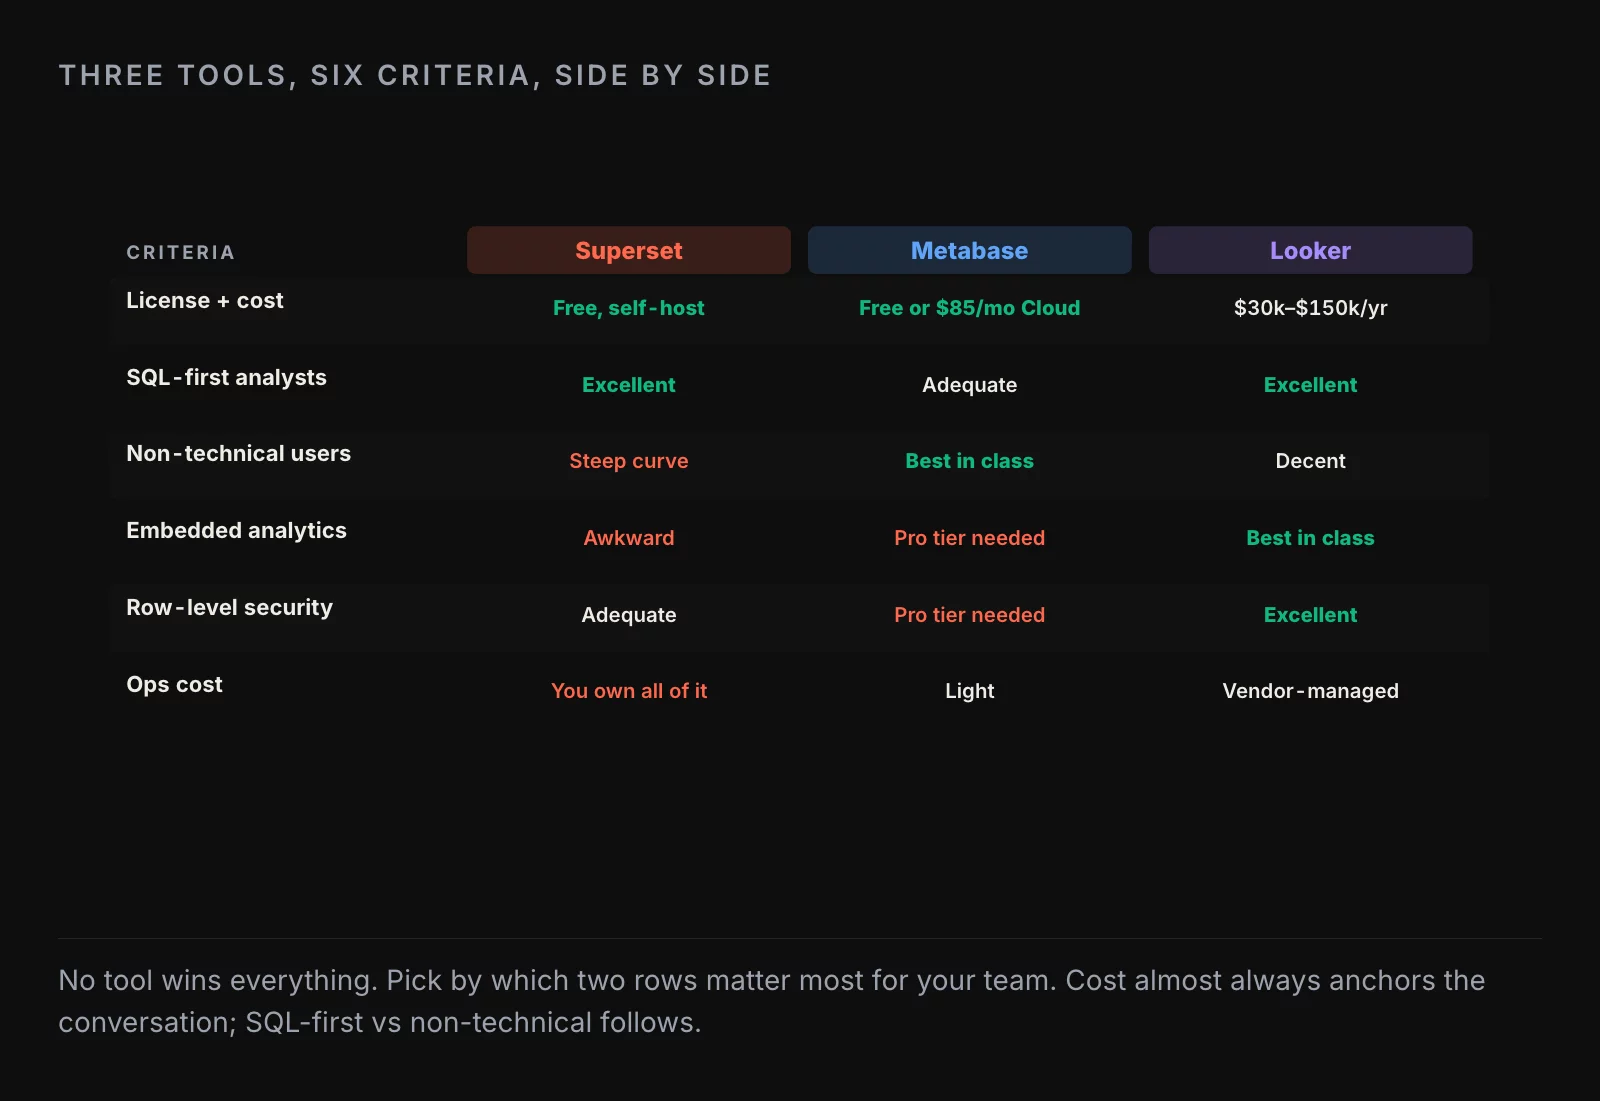
Three honest profiles, three honest verdicts. The early-stage startup with one analyst should skip Superset and ship Metabase or a notebook-based reporting stack. The mid-team with a part-time platform engineer and analysts who write SQL is the sweet spot: Superset earns its keep here. The enterprise with strict RBAC, customer-facing embedded analytics, and twenty-plus dashboard authors should either commit to Preset’s managed offering or evaluate the closed-source alternatives (Looker, Tableau) for the embedded use case specifically.
The middle row is the only one that requires real thinking. The other two answer themselves.
What changed in 2025
Three things worth knowing if you last looked at Superset in 2023.
The native filter system finally matured. Cross-dashboard filters propagate without per-chart configuration. Default value sets work. The 1.x dashboard editor pain is gone.
The alerting and reporting pipeline got a real overhaul. Slack alerts are reliable; email alerts handle attachments correctly; PDF reports look reasonable on standard chart types. The “set up an alert and forget about it for a quarter” workflow works.
The embedded SDK is no longer experimental. Production deployments are common enough that the public examples are useful. Embedding is still a real engineering task, but it is a task with documentation that matches reality.
The honest summary
Superset in 2026 is the right BI tool for the team that has at least half a full-time platform engineer and analysts who are fluent in SQL. It earns its spot through chart breadth, dashboard composition, and SQL Lab. It costs you in operational complexity and in the cases where your governance requirements outrun the built-in RLS.
For the team without a platform engineer, Metabase remains the simpler answer and Preset removes most of the ops burden if you want the Superset experience. For the team with stringent customer-facing embedding requirements, Tableau or a custom build on top of the warehouse may be the right answer instead.
Free BI is never free. It is deferred infrastructure cost. The question is whether the team has the engineering capacity to absorb that cost in exchange for a more flexible tool. For the right team, the answer is a confident yes. For the wrong team, the answer is “you should have shipped Metabase six months ago.”
About the author
Nick Valiotti is the founder of Valiotti Data. 15+ years building analytics infrastructure for SaaS, marketplaces, and consumer subscription. 50+ production deployments across BigQuery, Snowflake, dbt, Metabase, and modern BI stacks. Author of two books on data strategy. LinkedIn · Discovery call.
![[REVIEW] Looker Studio vs Power BI 2026](https://valiotti.com/wp-content/uploads/2026/06/looker-studio-vs-power-bi-2026-hero-768x512.png)