Is it time for Tableau to retire?
In This Article
Sure, Tableau is still considered the industry standard for a reason. But let’s be honest — the world’s moving fast, and there are plenty of newer tools on the market offering similar (or even better) capabilities.
One of the buzziest contenders? Sigma Computing — a so-called “next-gen” analytics platform.
So where should you be building your dashboards in 2026 — with the trusty old Tableau or the shiny new Sigma?
Architecture & Data Approach
Let’s start with the basics: what’s under the hood?
Tableau is built around a desktop-server architecture. Most people load their data into Tableau Desktop, build visuals, and then publish to Tableau Server or Tableau Online. You can connect it to almost anything — even just a regular Excel file.
But Tableau likes its data clean and prepped. Think of it as a tool for those who like to plan ahead: clean schemas, thoughtful joins, well-structured logic. It’s made for mature data setups, with lots of sources and serious computation needs.
Sigma, on the other hand, is cloud-first and cloud-only. It doesn’t import data — it connects directly to cloud warehouses like BigQuery or Snowflake in real-time. You just open it in your browser and start exploring. Alone or with your team (more on that later).
The catch? Fewer connectors than Tableau. And since it’s a strict SaaS tool, you can’t deploy it on-prem. For some companies, that’s a dealbreaker.
UX & Ease of Use
Now let’s talk about what it’s actually like to use these tools.
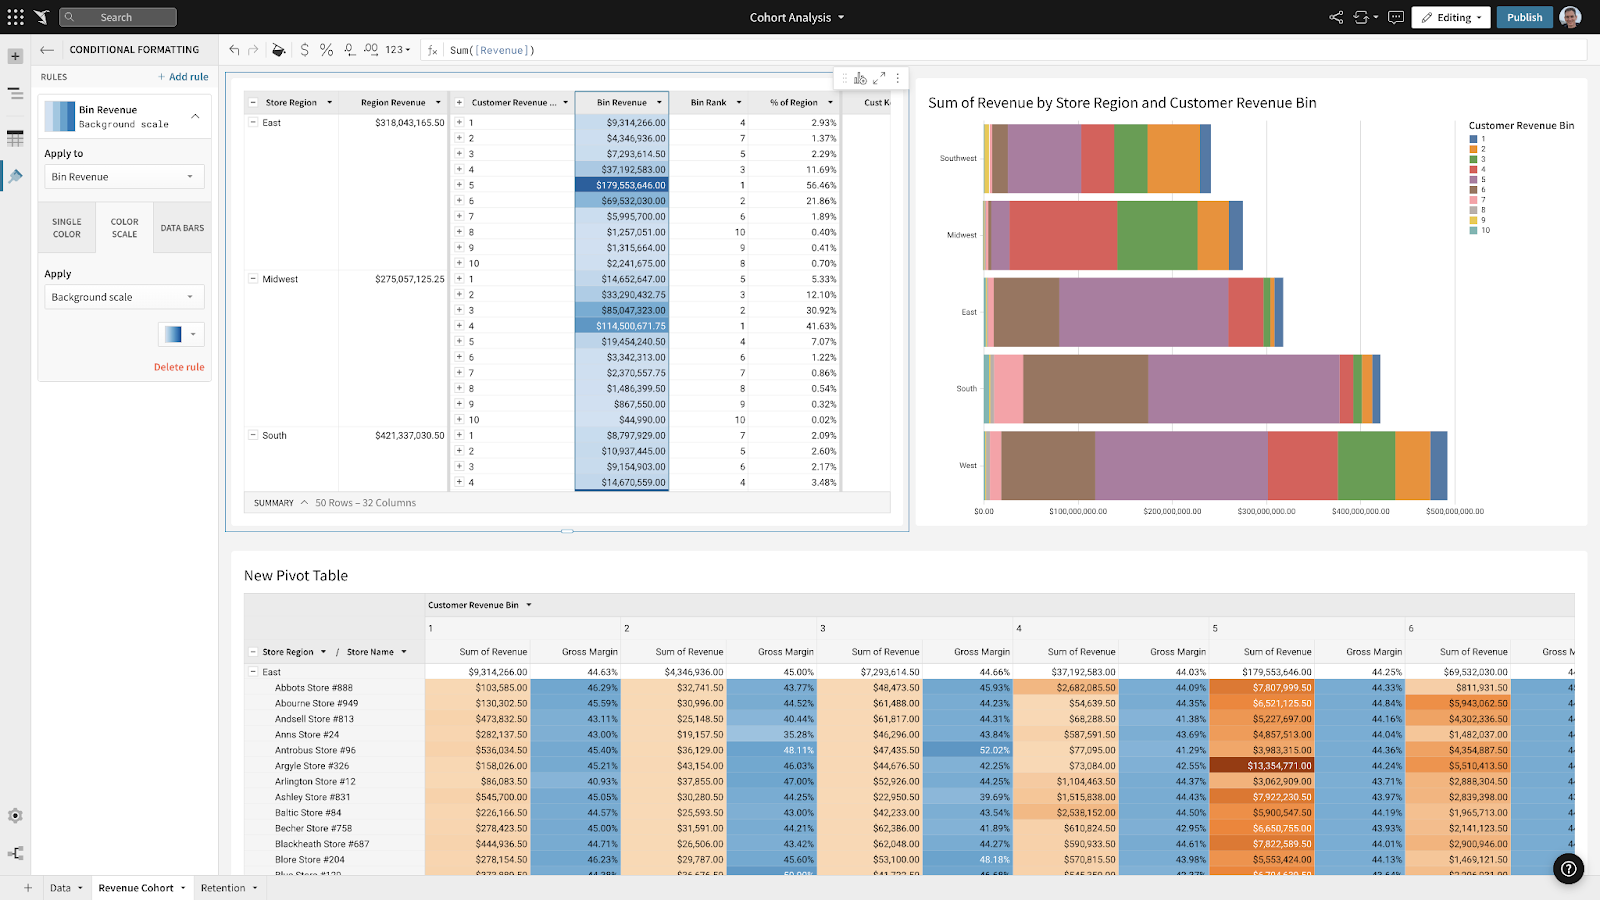
Tableau is the Photoshop of data. Incredibly powerful — but not exactly beginner-friendly. Once you get the hang of it, you can create stunning dashboards, interactive visuals, custom filters, maps, graphs, you name it.

https://cdnl.tblsft.com/sites/default/files/blog/untitled2.gif
But there’s a learning curve. Even basic dashboards are tricky for non-analysts. And new analysts? Prepare for a bit of a climb.
See what we build for our clients with Tableau.
Sigma, in contrast, feels like using Google Sheets or Excel. And that’s kind of its secret weapon. Business users don’t need to learn a whole new interface — it speaks the language they already know: tables. You’ve got cells, formulas, filters — just like Excel.
Only this time, it’s not 10,000 rows… it’s millions. Even billions.
When it comes to visuals, yes — Sigma is more basic. You won’t get the crazy customization Tableau offers, but you can build clean, decent dashboards. And if you’re more table-heavy in your work? Sigma shines.
Collaboration & Access Control
Some folks build dashboards just for fun (I made one to track my kids’ first days, no joke). But usually, they’re for work. So — how do Tableau and Sigma handle teamwork?
Tableau gives you solid access control. You can assign roles, set view-only permissions, leave comments, and set up alerts. You can work on a dashboard with your team or create a simplified version for users — they can filter and view but not break anything.
The workflow is mostly asynchronous: “I build, you check it later.”
Sigma feels more like Google Docs. Multiple people can work on the same report at the same time. Want to share it? Just drop a link. Live editing and collaboration are built into its DNA.
Access controls are flexible too — you can limit row-level visibility so, say, managers only see data from their department.
Performance & Scale
Now the fun part — what happens when you’re dealing with tons of data?
Tableau relies on its in-memory engine, Hyper, to crunch large volumes of data. It’s optimized for CPU and memory and handles complex queries well. But eventually, you’ll hit a wall — and have to start aggregating, sampling, or upgrading servers.
Sigma, on the other hand, never touches your machine. Everything runs in the cloud, directly in your data warehouse — even if you’ve got petabytes to analyze. No extracts, no duplication, no heavy lifting on your laptop.
Pricing
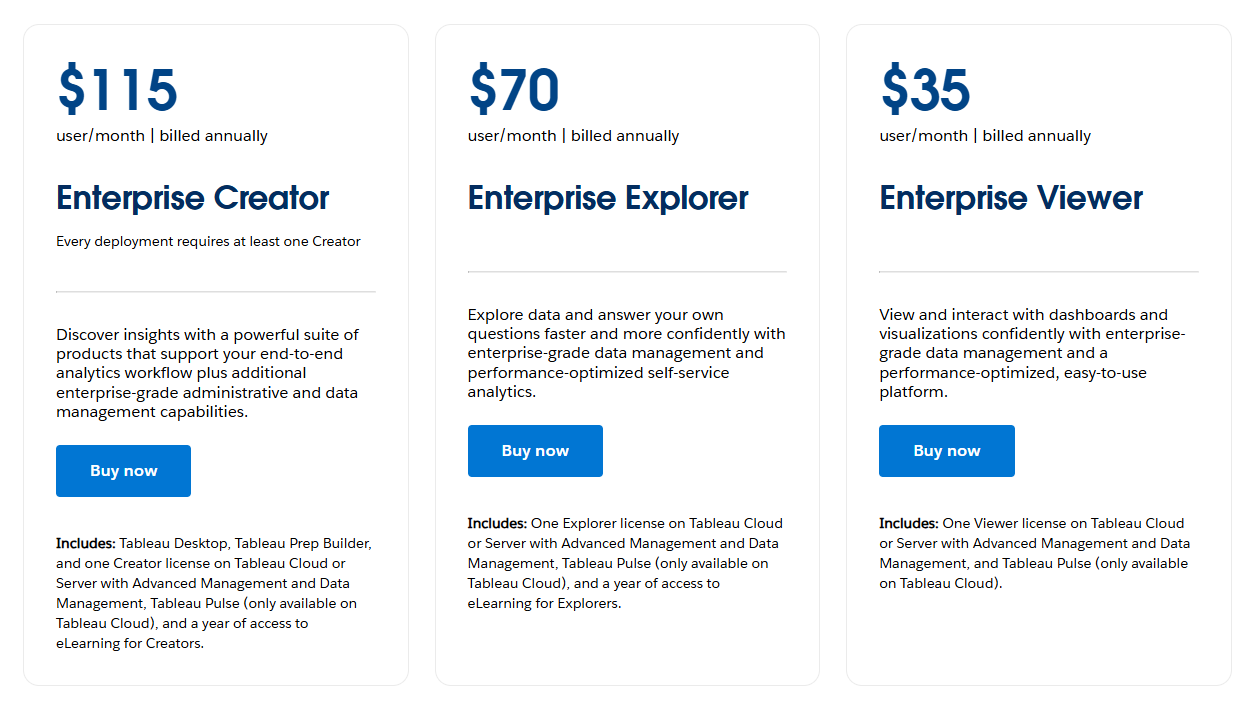
Tableau follows a role-based pricing model (Creator, Explorer, Viewer) and offers desktop, server, and cloud options. Prices are clearly listed on their site and scale with the number of users.
Sigma keeps it mysterious. No public pricing — which already puts it at a disadvantage. From what users report, it also depends on the number of users and the volume of data. If you’re curious, you’ll have to contact their sales team.
Final Verdict?
As always — friendship wins. Both tools are great, but built for different purposes.
The main difference isn’t the visuals, connectors, or features. It’s philosophy.
Tableau is built for analysts. It takes expertise, but gives you near-infinite customization — perfect if you’ve got a BI team and a complex data setup.
Sigma is built for business users. It’s simpler, faster to onboard, and plays beautifully with cloud data — so even your marketing or finance lead can explore data without bugging the analytics team.
About the author
Nick Valiotti is the founder of Valiotti Data. 15+ years building analytics infrastructure for SaaS, marketplaces, and consumer subscription. 50+ production deployments across BigQuery, Snowflake, dbt, Metabase, and modern BI stacks. Author of two books on data strategy. LinkedIn · Discovery call.


