Quick answer: A materialized view in ClickHouse is a stored, pre-computed query result that updates automatically as new data arrives. Used for real-time aggregations, ETL-like transformations on insert, and dashboard acceleration. Defined with CREATE MATERIALIZED VIEW. Three engine types matter: AggregatingMergeTree for sums and counts, ReplacingMergeTree for upserts, SummingMergeTree for additive metrics.
In This Article
A materialized view in ClickHouse is a table whose contents are defined by a SELECT and refreshed automatically as new rows land in the source. Used well, they collapse expensive aggregations into a single index lookup. Used carelessly, they multiply storage cost and turn into a debugging nightmare.
This article is the one materialized-view pattern we reach for most on consulting engagements: pre-aggregating ad-platform metrics from a fact stream into a daily summary table. It’s specific enough to be concrete and general enough that swapping Meta Ads for Google Ads or TikTok Ads is a column rename, not a redesign.
The problem
A client running paid acquisition pulls Meta Ads insights into ClickHouse every hour. The source table is row-per-(campaign, day) granularity. Their dashboard queries always group by date_start to show daily spend, impressions, and clicks across all active campaigns. Two months in, the dashboard query is scanning 40M rows on every refresh and the marketing team is complaining about the 8-second lag.
The fix isn’t bigger hardware. It’s a materialized view that pre-aggregates the daily totals as new rows arrive.
The schema
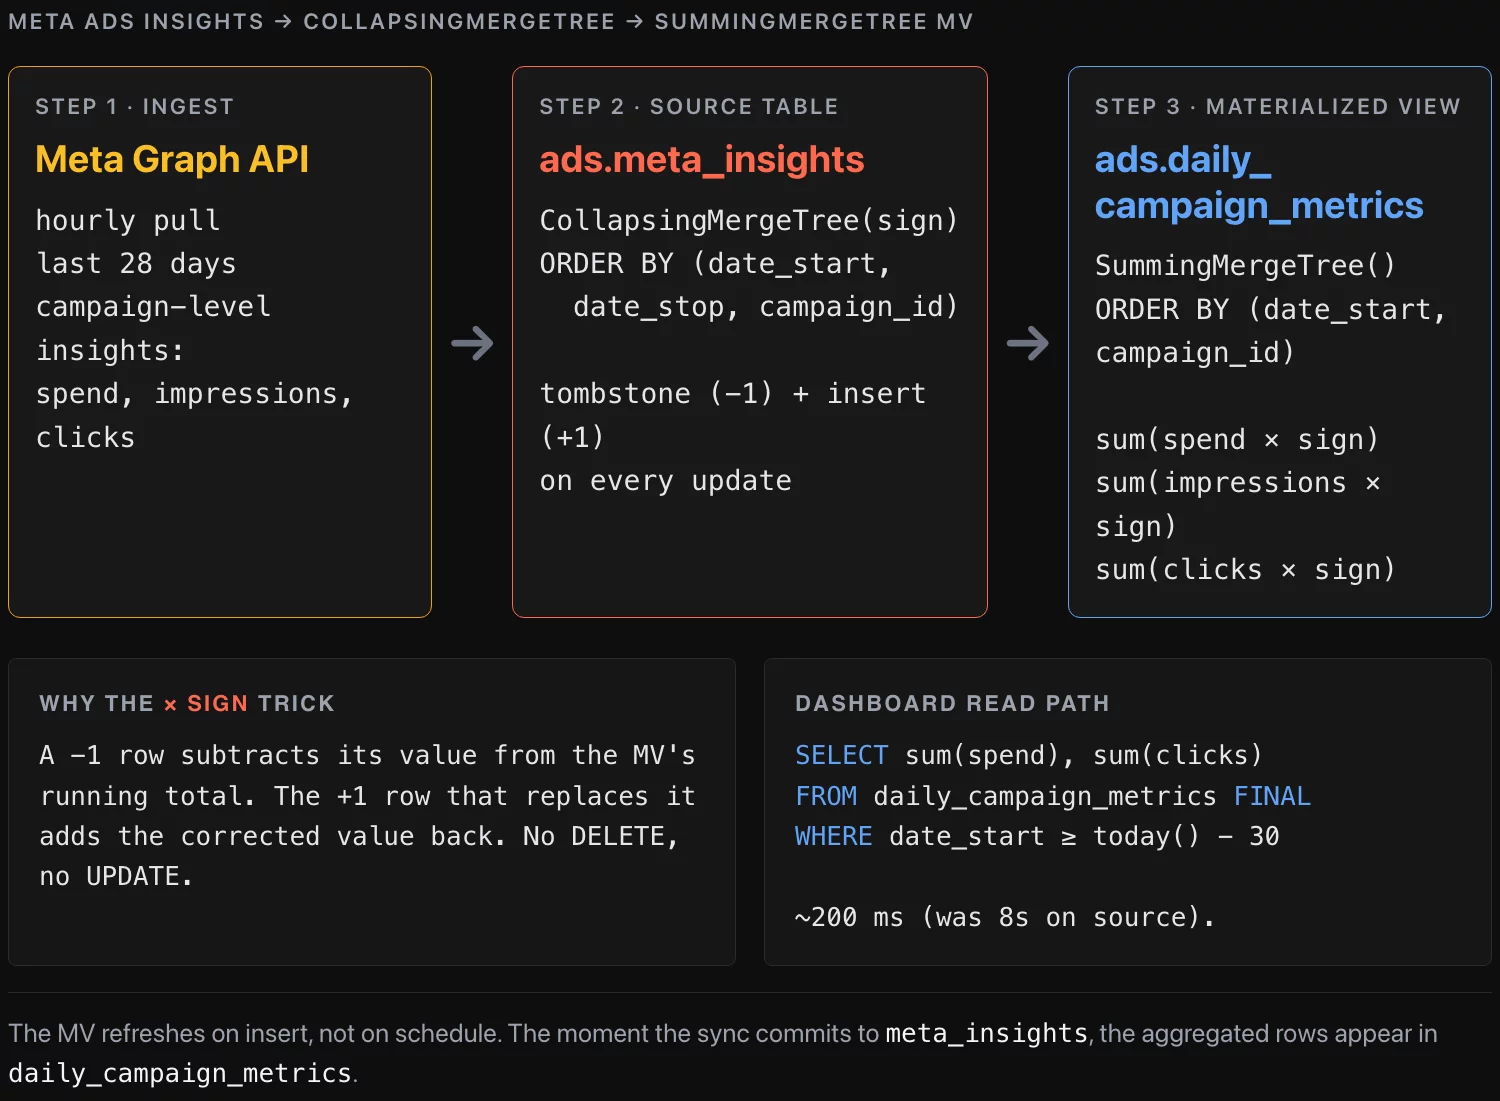
The source table uses CollapsingMergeTree so we can handle updates — Meta’s API re-sends metrics for the last 28 days as attribution windows close, so the same (campaign_id, date_start) shows up with corrected numbers. The sign column tracks whether a row is a current value (+1) or a tombstone for an old value (-1):
CREATE DATABASE ads;

CREATE TABLE ads.meta_insights (
    campaign_id  UInt64,
    date_start   Date,
    date_stop    Date,
    spend        Float32,
    impressions  UInt32,
    clicks       UInt32,
    sign         Int8
)
ENGINE = CollapsingMergeTree(sign)
ORDER BY (date_start, date_stop, campaign_id);
The materialized view sits on top and aggregates into SummingMergeTree, which collapses rows with the same ORDER BY key by summing their numeric columns:
CREATE MATERIALIZED VIEW ads.daily_campaign_metrics
ENGINE = SummingMergeTree()
ORDER BY (date_start, campaign_id)
AS
SELECT
    date_start,
    campaign_id,
    sum(spend * sign)       AS spend,
    sum(impressions * sign) AS impressions,
    sum(clicks * sign)      AS clicks
FROM ads.meta_insights
GROUP BY date_start, campaign_id;
The * sign trick makes the negation arithmetic. When a sign = -1 row lands, its values subtract from the running total in the MV. The +1 row that replaces it adds the corrected values back in.
The update workaround
ClickHouse doesn’t have a row-level UPDATE in the OLTP sense. The supported pattern for “this row changed” is: insert a -1 row that’s identical to the old one, then insert a +1 row with the new values. The Collapsing engine reconciles on the next merge. The MV picks up both inserts and the running totals stay correct.
Here’s the Python that does this. It runs once an hour, pulls the latest insights from Meta’s Graph API, and writes the diff into ClickHouse:
from clickhouse_driver import Client
from datetime import date, timedelta
import requests

ch = Client(host='clickhouse.internal', database='ads')

def fetch_meta_insights(since: date) -> list[dict]:
    """Pull the last 28 days of campaign-level insights from Meta's API."""
    resp = requests.get(
        f"https://graph.facebook.com/v19.0/act_{AD_ACCOUNT}/insights",
        params={
            'level': 'campaign',
            'fields': 'campaign_id,date_start,date_stop,spend,impressions,clicks',
            'time_range': f'{{"since":"{since}","until":"{date.today()}"}}',
            'access_token': META_TOKEN,
        },
    )
    return resp.json()['data']

def sync():
    since = date.today() - timedelta(days=28)
    fresh = fetch_meta_insights(since)

    # Pull whatever ClickHouse currently thinks the last 28 days look like
    current = ch.execute("""
        SELECT campaign_id, date_start, date_stop, spend, impressions, clicks
        FROM ads.meta_insights FINAL
        WHERE date_start >= %(since)s
    """, {'since': since})

    # Build tombstone rows for every existing record
    tombstones = [(*row, -1) for row in current]

    # Build fresh rows tagged with sign=+1
    inserts = [
        (
            int(r['campaign_id']),
            r['date_start'],
            r['date_stop'],
            float(r['spend']),
            int(r['impressions']),
            int(r['clicks']),
            1,
        )
        for r in fresh
    ]

    ch.execute(
        "INSERT INTO ads.meta_insights "
        "(campaign_id, date_start, date_stop, spend, impressions, clicks, sign) VALUES",
        tombstones + inserts,
    )
    ch.execute("OPTIMIZE TABLE ads.meta_insights")
    ch.execute("OPTIMIZE TABLE ads.daily_campaign_metrics")

if __name__ == '__main__':
    sync()
A few details that matter:
SELECT ... FINALforces collapsing on read so we get the current (deduplicated) state. WithoutFINALyou’d see both the+1and-1rows from the previous run.OPTIMIZE TABLEtriggers a synchronous merge. ClickHouse merges in the background anyway, but the dashboard query immediately after the sync wants to see clean data. In production we call this only after sync, not on every dashboard refresh.- The MV refreshes on insert, not on schedule. The moment the
INSERTcommits tometa_insights, the matching aggregated rows appear indaily_campaign_metrics. No separate cron.
Verifying it works
After the sync runs, the dashboard query against the materialized view is one row scan per date in the date range, not 40M:
SELECT
    date_start,
    sum(spend)       AS spend,
    sum(impressions) AS impressions,
    sum(clicks)      AS clicks
FROM ads.daily_campaign_metrics FINAL
WHERE date_start BETWEEN today() - 30 AND today()
GROUP BY date_start
ORDER BY date_start;
On the client’s hardware this dropped from ~8 seconds to under 200 milliseconds. The marketing dashboard refreshes in real time and the source-table scan is reserved for the analytics team’s ad-hoc drill-downs.
Where this pattern breaks
A few cases where we’ve watched this go wrong on engagements:
- High-cardinality
GROUP BYin the view. Aggregating by(date_start, campaign_id, ad_set_id, creative_id, country)blows up the row count in the MV. The view becomes nearly as big as the source. Aggregate only as deep as your dashboard actually queries. - *Forgetting
sign on a numeric column*. If you addreachlater and writesum(reach)instead ofsum(reachsign), the MV double-counts every update. We’ve seen this in code review more than once. OPTIMIZE TABLEon a multi-TB table during business hours. The synchronous merge can lock the table for minutes. Run it off-peak, or rely on background merges and trustFINAL.- Backfills. If you need to reprocess the last six months because Meta changed an attribution model, you have to insert tombstones for the entire range first, then the fresh rows. The MV will handle it correctly but the source table doubles in size during the operation. Plan capacity.
When to use, when not to
Reach for this pattern when:
- The aggregation grain is fixed (daily, hourly, per-customer)
- The dashboard always groups the same way
- Source data has predictable updates with a stable primary key
- You can tolerate eventual consistency between source and view (seconds, not minutes)
Don’t reach for it when:
- The aggregation grain changes per query (use the source table directly)
- Sources are append-only with no updates (just use a regular
SummingMergeTreeon the source — nosignneeded) - The aggregation is one part of a larger join (materialize the join result, not just the aggregation)
Takeaway
Materialized views with CollapsingMergeTree + SummingMergeTree + the sign trick are the cleanest way we know to keep daily-totals dashboards fast on ClickHouse when the underlying data updates. The pattern fits Meta Ads, Google Ads, TikTok Ads, any ad-platform feed. Swap the column names, keep the engines, keep the * sign arithmetic, and the same skeleton ships.
About the author
Nick Valiotti is the founder of Valiotti Data. 15+ years building analytics infrastructure for SaaS, marketplaces, and consumer subscription. 50+ production deployments across BigQuery, Snowflake, dbt, Metabase, and modern BI stacks. Author of two books on data strategy. LinkedIn · Discovery call.
![[REVIEW] Looker Studio vs Power BI 2026](https://valiotti.com/wp-content/uploads/2026/06/looker-studio-vs-power-bi-2026-hero-768x512.png)