Metabase vs. Tableau
11 minutes
41
Not so long ago, companies had to pay for expensive enterprise software and employ a cadre of data scientists and data engineers, or both, to get good analytics. But as the value of analytics continues to grow, the barrier to entry has been lowered by the introduction of new software.
However, such tools are not built the same, and the two business intelligence tools we want to pit against each other today are Metabase and Tableau. Let’s compare them!
Introducing Metabase and Tableau
Before we go on: What does, anyway, data analytics mean as a term? This practice encompasses a range of tools, technologies, and processes to convert raw data into actionable insights. And the BI tools we are going to explore are integral to shaping business processes, improving decision-making, and fostering business growth.
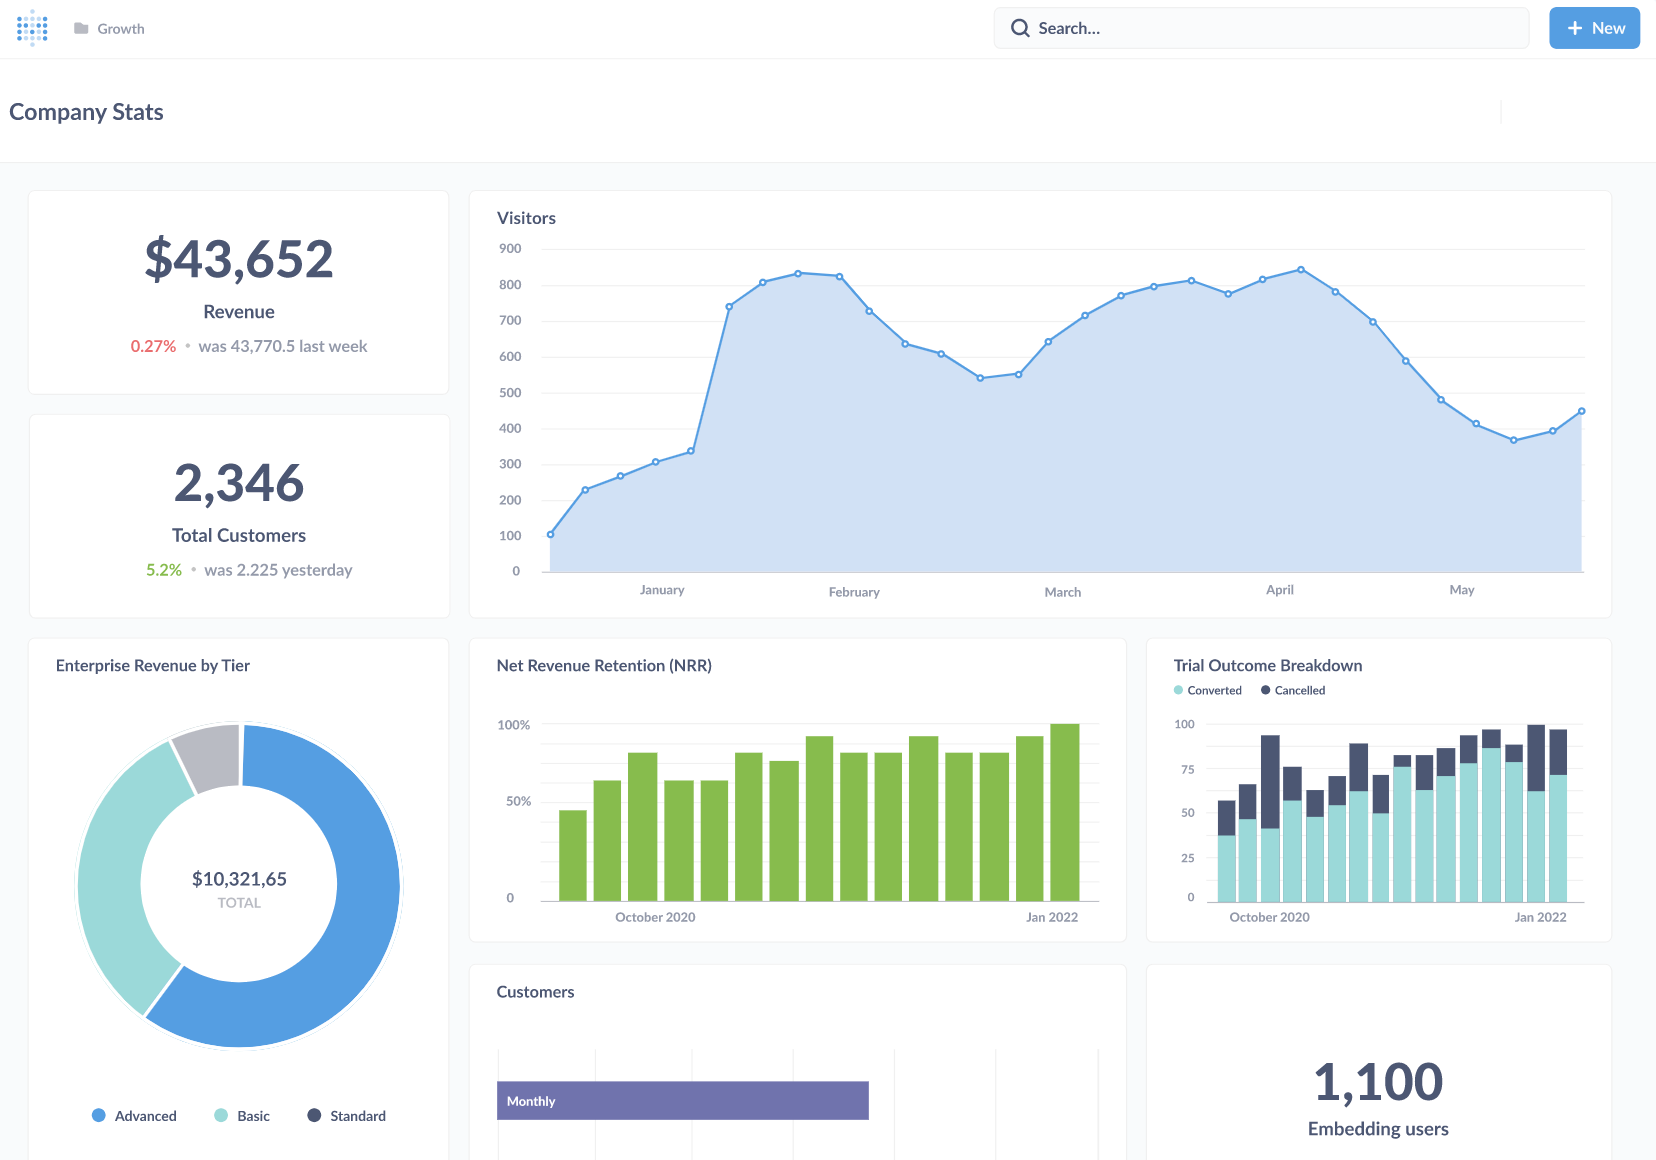
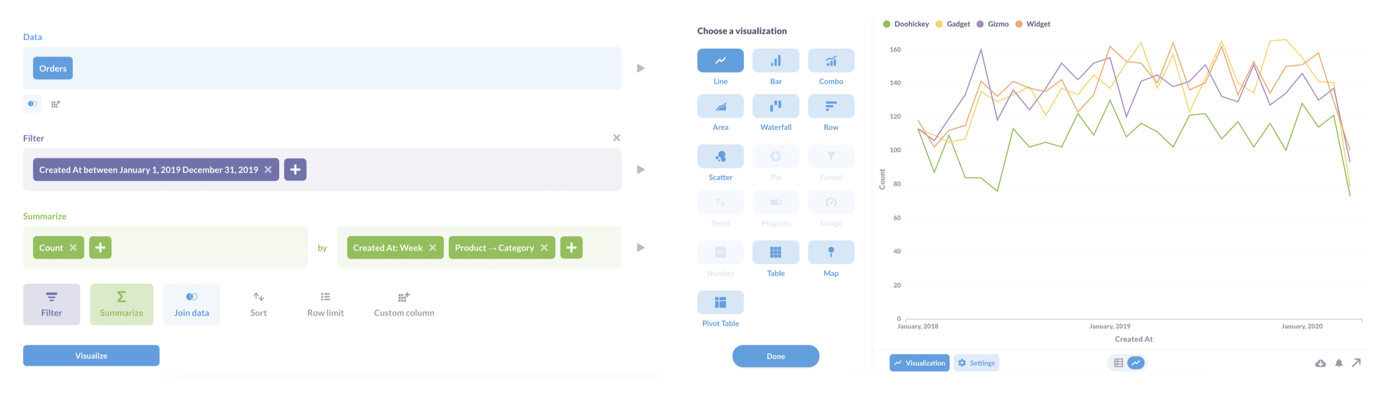
Metabase is an open-source tool that allows you to create BI dashboards, charts, and other visuals based on data from a variety of databases and sources. Users can explore the tool and learn from data without knowing code or SQL—but to a limited extent. For those planning to create visualizations and make advanced customizations, SQL is required.
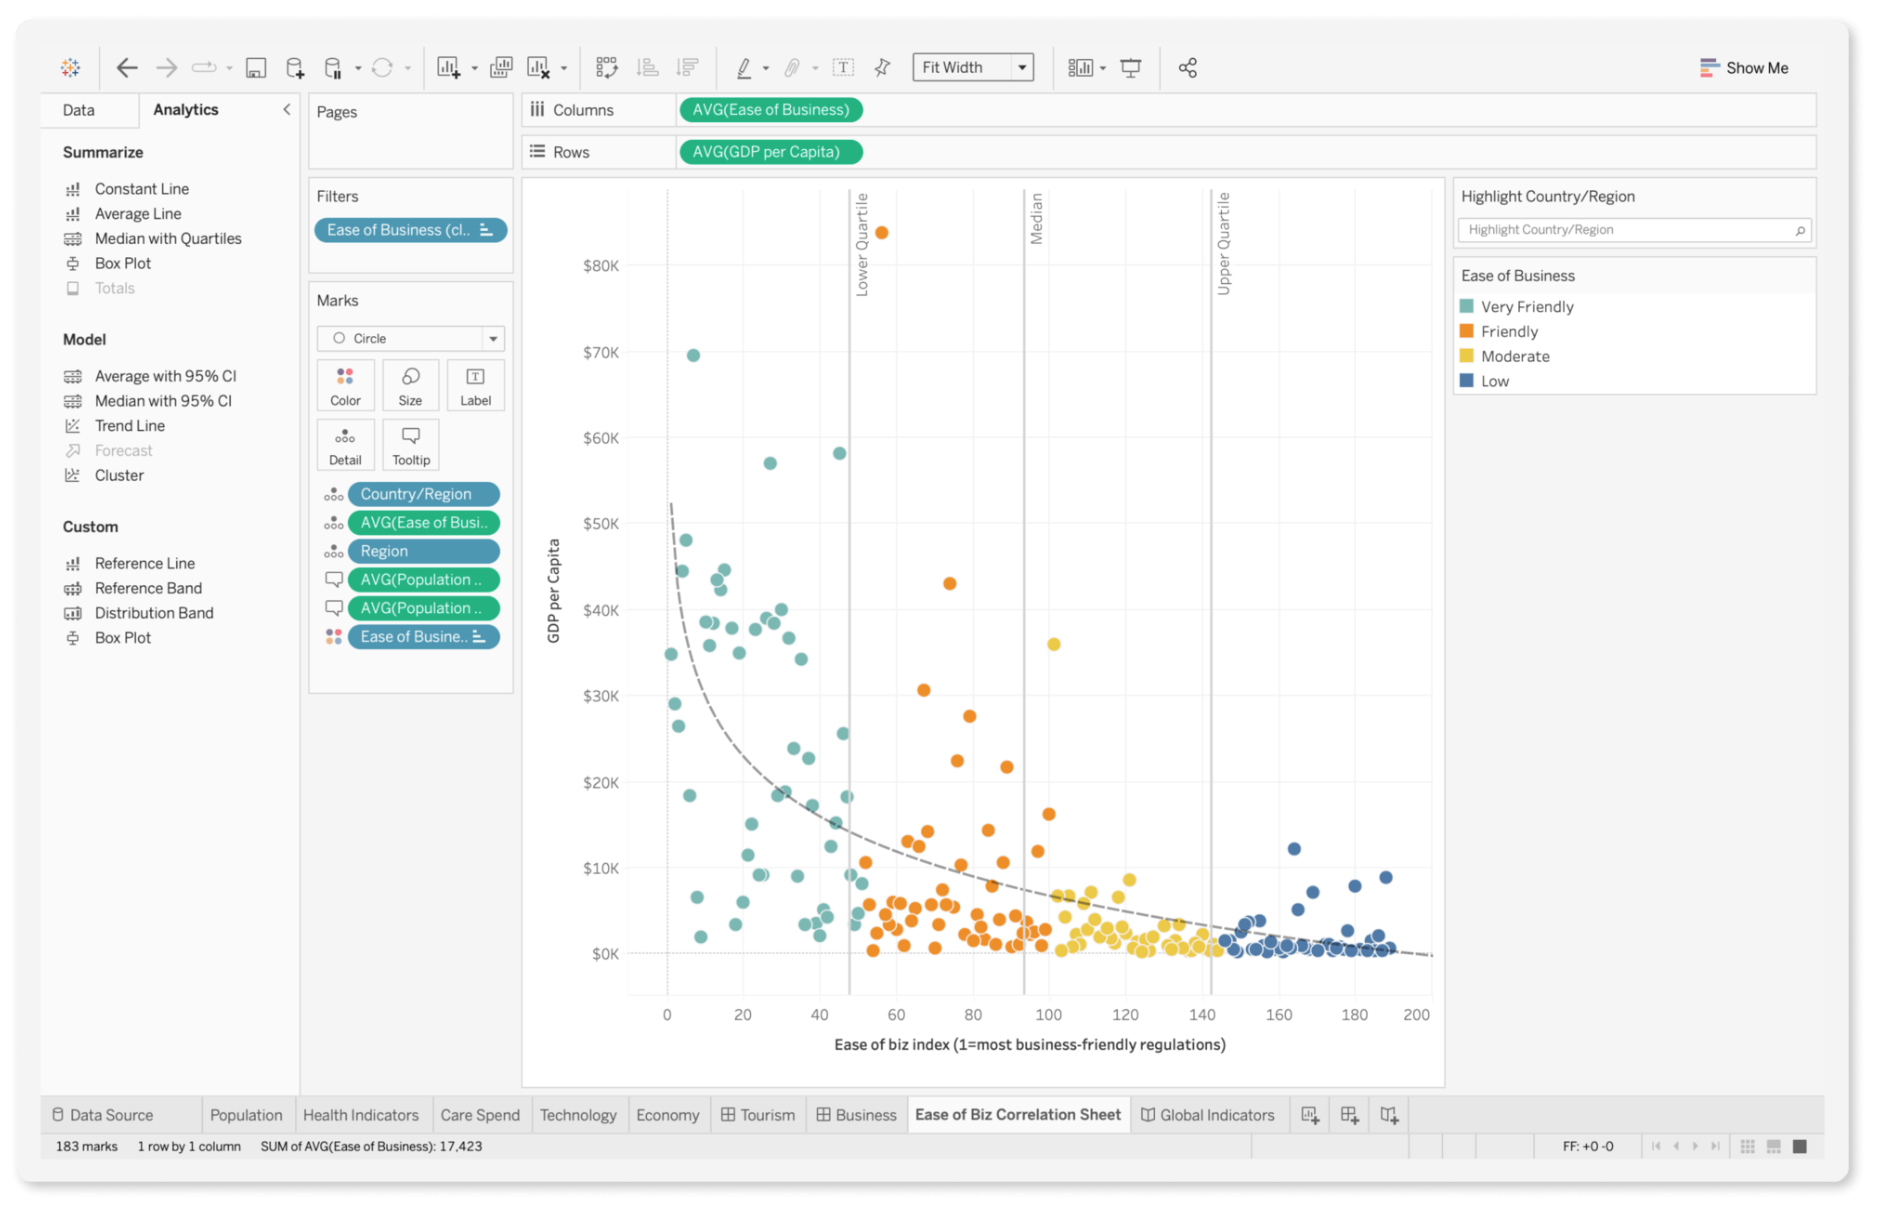
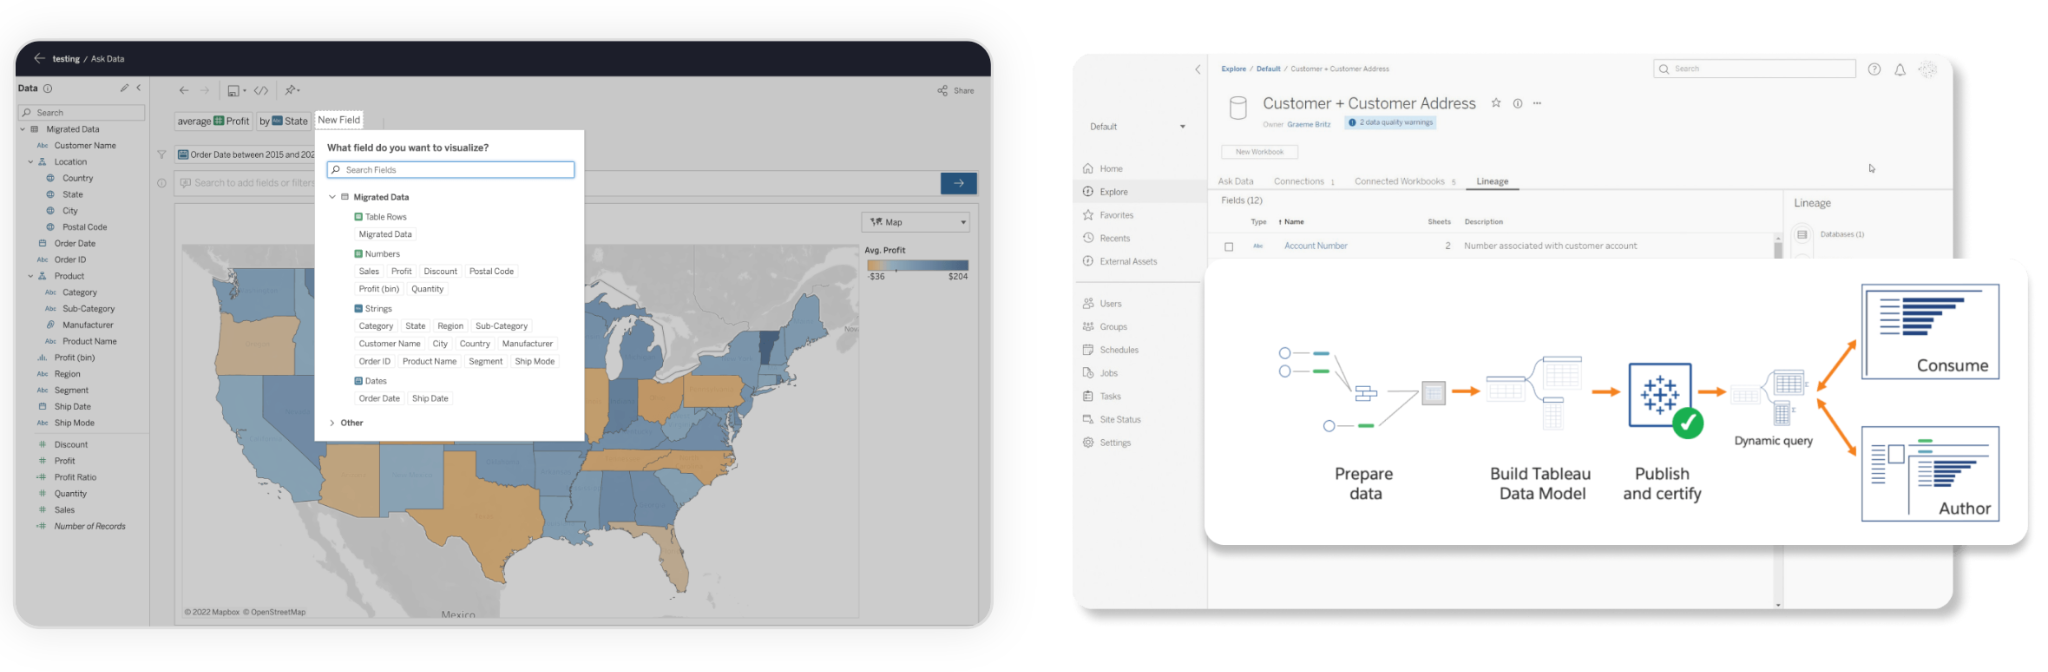
Tableau is a paid visual-analytics platform, also used for reporting and analyzing vast volumes of data. Tableau allows you to use custom SQL queries when you are connected to a database, too. But this is not required unless you need sophisticated visual analysis.
Background & Company Details
Metabase as a company dates back to 2017, but the 0.1 version of the software was released a few years prior. The reaction to the initial release surprised and delighted the team behind it, so they’ve been actively working on feedback and requests ever since.
Tableau’s very first release in 2005 was based on a visual query language for databases VizQL. The VizQL Server is essentially a translator of SQL queries, which loaded and rendered views and computed and executed queries.
The platform’s significant growth started in 2005, with the company roughly doubling in size every year until 2015. In 2019, the company was acquired by Salesforce, becoming its largest acquisition at the time.
Customer Base & Market Share
According to Slintel, which specializes in capturing technographic-powered buying intent, Metabase and Tableau vary greatly in sizes of customer base and market share. Tableau is in the lead.
The Tableau software has close to 70,000 customers, while Metabase has under 1,000 customers. The sizes of customer bases put Tableau in second place in the analytics category, and Metabase is in 72nd place.
As for the market share in the analytics category, Tableau has a 1.29% share, and Metabase has 0.02%.
Basic and Additional Features
Metabase doesn’t come with the widest set of features, but the functionality it does offer works well and does the job:
- Dashboards: For grouping questions and presenting them on a single page
- Key performance indicators reporting: Tracking performance measurements on a continuous basis
- Visual analytics: Of course, what is analytics without visualizations? So, Metabase has 15+ built-in visualizations (line, bar, area, row, scatter, waterfall, and more)
Now, here is a list of features to help you get a better idea of Tableau and its potential:
- Dashboards: Comparing a variety of data simultaneously
- Visual analytics: Charts (pie, treemaps, histograms, bullet graph, etc.), geospatial (proportional symbol maps, choropleth, isopleth, area maps), tables (highlight tables and heatmaps)
- Performance metrics: Tracking business data, which is updated automatically, so the tool displays the most recent value
- Trend/problem indicators: Estimating a relationship between continuous variables
- Ad hoc reports: Creating and sharing reports on-the-fly
- Scorecards: Getting a momentary look into certain KPIs over a set period of time
- Benchmarking: Evaluating data with a standard
- Profitability analysis: Mapping and tracking the profitability of the business, a specific customer, etc.
- Predictive analysis: Generating predictions about your data
- Strategic planning: Defining your organization’s vision for analytics, documenting the current state of the enterprise architecture, assessing the usage of data and analytics
- Publishing: Sharing data, reports, and dashboards with your team, company, and customers
Integrations
Metabase has numerous native and partner data sources to choose from:
- Databases (PostgreSQL, MySQL, MongoDB, Amazon DynamoDB, Microsoft SQL Server, Clickhouse etc.)
- Files (JSON, Google Sheets, CSV, Dropbox, etc.)
- Cloud storage (Google Cloud Storage, Azure Blob Storage, Cloud SQL for PostgreSQL, etc.)
- Services (Amazon S3, Amazon Cloudfront, SFTP, Zapier, etc.)
- Developer tools (Twilio, GitHub, IBM DB2, QuickBase, etc.)
- CRM (Salesforce, HubSpot, Pardot, Lever, Zendesk Sell, etc.)
- Project management (Jira, Asana, Harvest, Trello, etc.)
Bear in mind that this is not the full list of possible integrations.
Tableau also offers native data connectors and partner systems. Native connectors are built and optimized for many databases and files, including simpler spreadsheets and PDFs to more complex big data, relational databases, and application data.
The connectors specifically highlighted on the website are:
- Microsoft SQL Server
- Amazon Redshift
- BigQuery
- Salesforce
- Splunk
- Snowflake
- PostgreSQL
- Hive
- Presto
- MySQL
A few partner ecosystems worth mentioning are:
- AWS
- Azure
- Google Cloud
- Informatica
- Collibra
- SAP
- Databricks
You can also embed or extend Tableau’s capabilities with data science and dashboard application integrations. The former allows you to dynamically leverage programming languages, tools, and platforms (R, Python, MATLAB, etc.). The latter enables customers to interact with data from other applications.
Supported Platforms
Metabase is available as a SaaS platform. The team behind the solution notes that it works on these versions of these browsers:
- Chrome (v70+)
- Firefox (v68+)
- Microsoft Edge (v17+)
- Safari (v11+)
Dashboards may run well on older versions of these browsers and even on browsers not listed, but the performance may vary. You can also run Metabase locally, but you need to have a Java Runtime Environment installed on your system.
Tableau comes on a much wider variety of platforms. Tableau Cloud, previously called Tableau Online, is a fully-hosted, cloud-based solution. The site takes a few clicks to activate, allowing you to quickly publish interactive dashboards and data.
In addition to being offered as an SaaS platform, it can also be installed on a desktop (Windows and Mac) and even has a mobile app companion (iOS and Android). The app automatically creates dashboard layouts optimized for mobile devices, which are also available offline and sync with the cloud when possible.
Pricing
Metabase is open-source and free; you can use it as long as you abide by the APGL (one of the less permissive licenses). If you embed Metabase widgets in your applications, you can do it with either a free license or a paid license. The latter allows you to drop the attribution logo and the URL.
Companies making money off of Metabase or powering their products with it are kindly asked to purchase a commercial license. The Starter Plan costs $85/month (for 5 users; for larger teams, it’s $5/user/month). The Pro Plan is $500/month for 10 users, then 10/user/month).
Tableau is a membership SaaS, and the pricing mainly depends on the number of users and the deployment type. The Tableau Server costs $12-$35/user/month, and the Tableau Cloud is $12-$42/user/month. Tableau Creator (includes Tableau Desktop, Prep Builder, and one Creator license on the Cloud) costs $70/user/month.
Also, Tableau has a 14-day free trial.
Typical Clients

The typical clients of Metabase are startups, SMEs, enterprises, and agencies. Over 40,000 companies reportedly use Metabase in their tech stacks, including Bitpanda, Dribbble, and Uptime. While the portfolio is not as impressive as Tableau’s, you should still check out its case studies.

The typical clients of Tableau are SMEs and enterprises. The platform empowers some of the world’s top organizations, such as Verizon, Lenovo, Lufthansa, Charles Schwab, and many more. If you’d like to get an idea of whether this business intelligence tool will fit your organization’s needs, look up the success stories and sort by region, industry, and department.
Common Use Cases
Metabase is marketed as a tool that you can use to ask questions about your data and apply in the following ways:
- Self-service business analytics: A relatively simplified version of business intelligence that enables casual business users to prepare and analyze data.
- Embedded analytics: Customer-facing analytics to ensure they can get the same quality insights the business can but for their own data.
- Interactive dashboards: Build and publish dashboards that can be shared with a quick link and embedded in websites, publications, or products.
The main use of Tableau—helping people see and understand their data—can be divided into the following applications:
- Big data: Handles the massive scale, growth, and variety of data and performs various types of analytics.
- Business dashboards: Creates interactive, real-time visualizations in minutes.
- Collaboration: Enables contributions, from web editing and authoring to data source recommendations.
- Maps: Rich, interactive maps with 16 levels of zoom
- Survey analysis: Allows exploring and filtering survey items
- Time series analysis: Helps to see data trends over different periods of time
Department-wise, Tableau is commonly used in finance analytics, human resources, IT management, marketing analytics, sales analytics, and support & service analytics.
Supporting Languages
Metabase was originally supported in English only. But with the user community’s effort, Metabase has been translated into many different languages. Certain languages may be removed during major releases because existing translations must stay at 100% to continue being included in the next major version.
Tableau Desktop and Server have been localized to English, French, German, Brazilian Portuguese, Spanish, Korean, Japanese, and simple Chinese. But it should be noted that Tableau supports Unicode/double-byte character sets. This means the interface can display any language, regardless of the official localization.
Training & Support
The training course of Metabase can be conducted via documentation, which will guide across all stages from installation to APIs. If you want to know how to build a BI dashboard, you’ll have to find that information yourself.
The support is not done by any official means and doesn’t hold any third-party vendors. But there is a core team that has written over 100,000 lines of code over three years, so you might get incredible help from the community.
The training of Tableau can be done through live online, in-person, webinars, and documentation. The easiest way to digest the introductory information is free videos for Creator, Explorer, Viewers, and Admins.
The support is available 24/7 through live chat and other means like email, phone, video conferencing, and business hours. All your questions, from basic “what does DBT stand for?” to more complex “how to create maps that show a path over time?”, should be answered promptly.
Recognition
Tableau has been a recipient of numerous awards over the years. These are a few examples of the most recent ones:
- Gartner’s Magic Quadrant named Tableau as a Leader for Analytics & BI Platforms for ten consecutive years.
- Tableau Desktop made it to TechRadar’s list of Best BI tools in 2021.
- Nucleus Research recognized Tableau as a Leader in Embedded Analytics Technology, detailing the reasons in their Value Matrix report.
- PC Magazine gave Tableau Desktop an Editor’s Choice award and included it in the list of The Best Self-Service BI Tools of 2020.
Metabase hasn’t been recognized to a similar extent.
Pros & Cons
| Metabase | |
| Pros | Cons |
| Free for on-prem, self-managed Fairly simple to learn and use Intuitive user interface Great for beginners and technically advanced users Has unique features like mailouts of reports and dashboards | Limited analytics Limited platform availability Lacks data governance No customer support beyond documentation Requires niche analysts |
| Tableau | |
| Pros | Cons |
| Extensive analytics & reporting Wide variety of deployment options Excellent data visualization Easily handles large amounts of data Extensive customer resources Mobile-friendly | More expensive per user Requires manual effort No automatic refreshing of reports No version control Time- and resource-intensive staff training |
Summary
Metabase is for companies and individuals looking for a free data visualization tool, not needing anything more complex than basic graphs, and wanting to go the DIY route using SQL. Just keep in mind the downsides we’ve listed and find ways to offset them.
From the perspective of many Tableau users, the advantages outweigh the disadvantages, making it one of the most preferred choices for creating interactive data visualizations. It offers a host of features empowering everything from reporting to strategic planning, supports different types of analytics, including advanced predictive analysis, and is incredibly flexible.
Plus, Tableau’s enablement resources, training, and global data community offer exceptional support for their analytics investments.
Nothing beats trying business solutions out for yourself. Thankfully, Metabase is free, and Tableau comes with an all-access free trial.

We convert raw data into meanigful insights for you to make the best decisions.
Featured Articles
-

Top 5 Data Visualization Tools in 2023
A simplified representation of complex data is key for any data-driven business. Raw data must be turned into a cohesively formatted visual that is…
Read more -

SnowFlake: The Best Data Warehousing and Prescriptive Analytics Solution
Data Warehouse as a Service, or DWaaS, has gained much popularity in the past decade. It is a service primarily provided by Snowflake Inc,…
Read more -

Simple Mobile Analytical Stack: Firebase + BigQuery
Developing reliable and high-quality mobile and web applications requires a lot of dedication and, more importantly, a powerful and feature-rich development platform. Firebase, provided…
Read more