20 KPIs for a Growing SaaS Business in 2023
12 minutes
23
How do you know if your company is on the right track? Three words: key performance indicators.
Progress can be quantified in one way or another, depending on the industry and the company. There are countless metrics to measure growth in size, number, amount, value, profit, productivity, and so on. To help you navigate SaaS KPIs as a growing company and condense them to the basics, we’ve put together a list of twenty-three metrics.
Why Key Performance Indicators in SaaS Matter
Whatever industry you’re coming from, tracking progress should be nothing new. All types of businesses should track their data, collect statistics, and analyze progress over time. By extension, the dynamic nature of KPIs is perfect for the fast-paced SaaS market.
SaaS KPIs reflect the current performance of your company in a brief snapshot. Whether it’s for your internal goal-setting and decision-making or you’re planning to obtain funding from investors, you’ll need concrete numbers to prove you’re making progress.
Without putting off the main topic any further, here are 20 essential SaaS KPIs.
1. Number of Customers/Subscribers
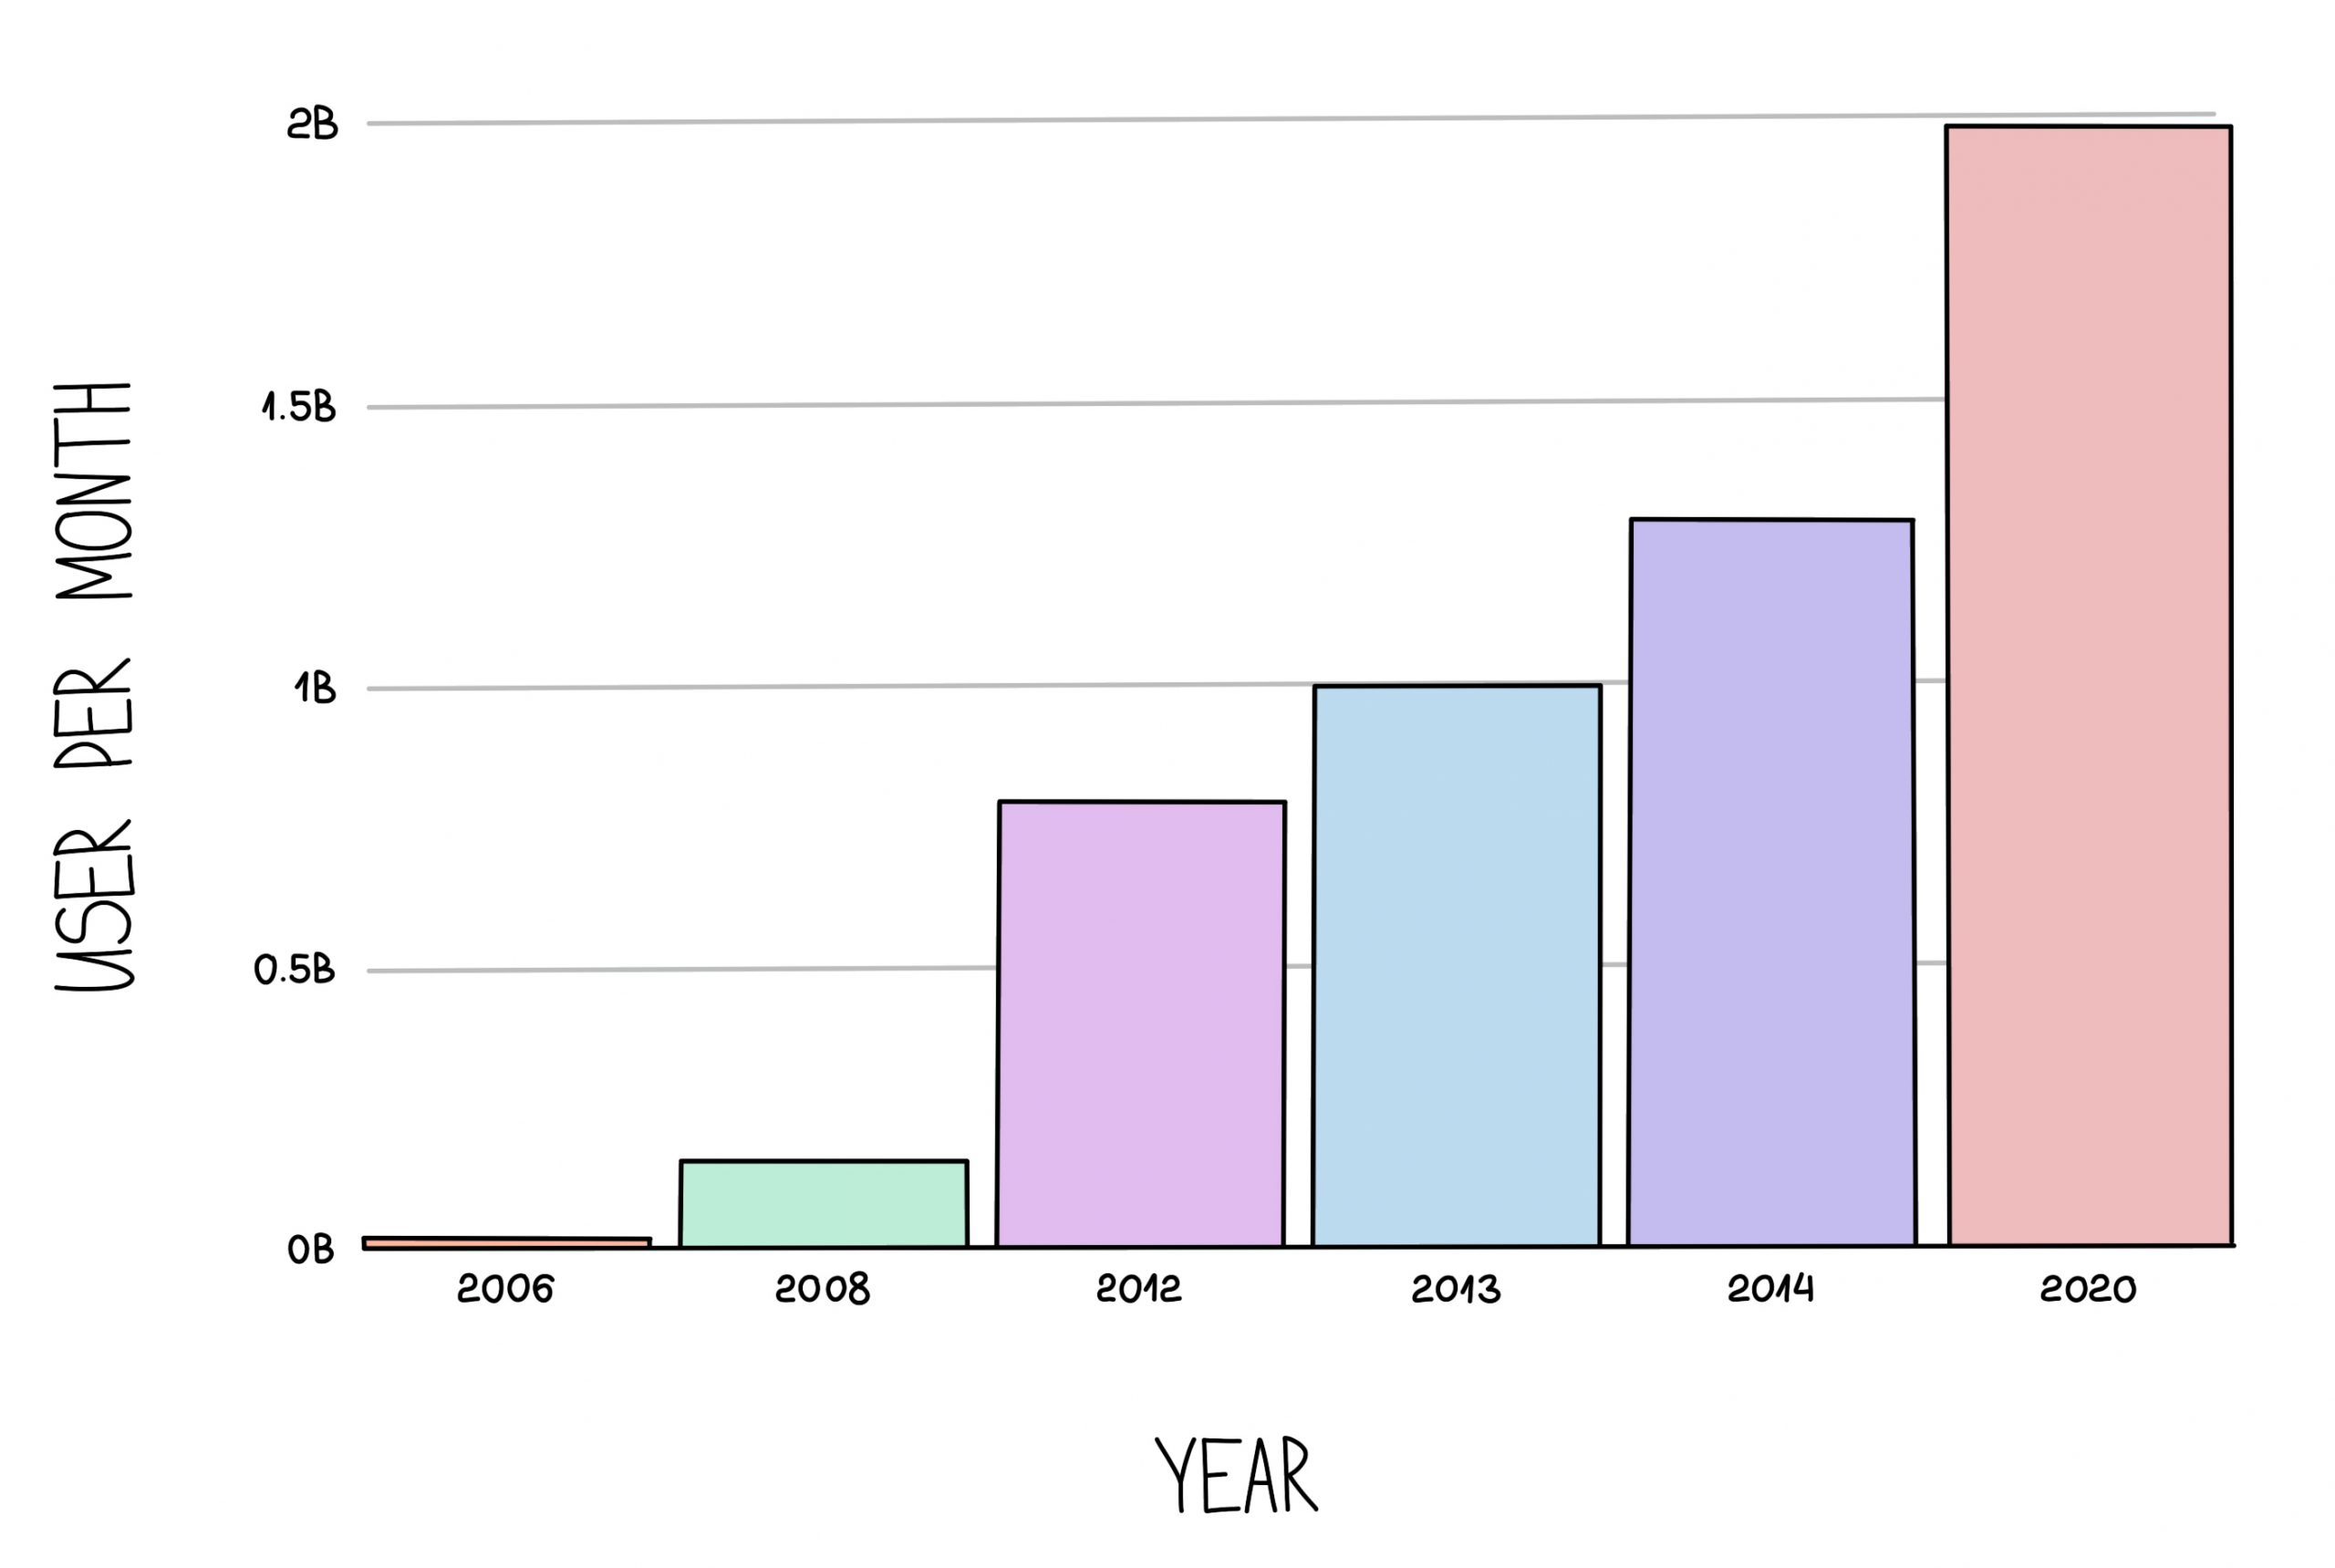
First and foremost, you should track how many people are buying your product. This number will be the basis of many further calculations.
Consider getting more granular than a flat number of buyers. We recommend tracking the following categories separately:
- New one-time buyers
- Recurring buyers
- Monthly subscribers
- Annual subscribers.
It can be helpful to identify overlaps in these categories; it can help you tailor your offer and make it more attractive for users. For example, if you see a bid overlap in yearly subscriptions + a specific add-on, make it a bundle offer.
2. Average Customer Lifespan
Average Customer Lifespan = Sum of Customer Lifespans – Number of Customers
where Sum of Customer Lifespans = (Customer 1 Last Order Day – First Order Day) + (Customer 2 Last Order Day – First Order Day) + …
Average Customer Lifespan is self-explanatory: it’s the amount of time between a customer’s first and last purchase when they no longer buy from your business. If your business is new and you can’t measure how long your typical customer/subscriber remains a customer/subscriber, divide 1 by your Churn Rate (more about Churn later). Or consider predictive modeling.
This is another stepping stone for formulas to come. But even as a standalone metric, you should be interested in and track how much time your customers spend with you.
3. Average Order Value (AOV)
Average Order Value = Total Revenue ÷ Number of Orders Placed
The AOV shows the dollar amount spent by a user each time they place an order on a website or mobile app. Some businesses are not operating based on growing AOV; for example, those who have a subscription plan with no tiers or add-ons. But the metric also highlights the spending patterns of customers.
4. Customer Lifetime Value (CLV)
Customer Lifetime Value = Average Order Value × Average Order Frequency × Average Customer Lifespan
Customer Lifetime Value, or just Lifetime Value (LTV), indicates how much revenue an average customer brings throughout their relationship with the brand/product. The longer the average customer lifespan, the greater their worth to the company. Similarly, higher order value or frequency increases CLV.
5. Total Revenue
Total Revenue = (Number of Units Sold × Per Unit Price) + One-Time Fees
Total Revenue, also called Gross Revenue, represents how much money the business is bringing in and is an indicator of cash flow. TR is not a metric to measure profitability (this will come later), but it can be a particular point of interest for investors.
Bear in mind that Total Revenue doesn’t take into account expenses or costs. This KPI is a starting point for understanding your ability to sell your SaaS product.
6. Monthly Recurring Revenue (MRR)

Monthly Recurring Revenue = Number of Subscribers × Average Order Value
Monthly Recurring Revenue averages your various pricing plans and billing periods into a single number. It can be hard to report revenue across different subscription terms and types, even excessively so. So, MRR is a simplified way of calculating how much the product is bringing in each month.
If you see this number going up each month, you can be certain the business is growing. You can also track MMR losses from downgrades or lost customers.
While you can’t guarantee MMR will grow continuously or even stay at the same level, it’s also often used to bring predictability to your revenue expectations.
7. Annual Recurring Revenue (ARR)
Annual Recurring Revenue = (Number of Yearly Subscribers × Subscription Cost Per Year) + Recurring Revenue from Add-ons – Revenue Lost from Cancellations
Don’t expect this formula to accurately represent how much revenue the product will generate in a year. It solely focuses on long-term subscribers without looking into short-term subscriptions, one-time purchases, and other non-recurring sources of revenue. As opposed to MMR, which measures the impact of recent changes, ARR is valuable for company road mapping and financial modeling.
ARR is popular with SaaS companies that sell multi-year subscription plans.
8. Gross Profit
Gross Profit = Total Revenue – Cost of Goods Sold
To know your Gross Profit, you need to know much you “lose” to “gain”; in other words, your costs in order to generate revenue.
Like any other, your business has to spend money to deliver your product, and the Cost of Goods Sold represents your list of expenses that directly supports all of your revenue streams. For most SaaS companies, the biggest expenses are labor (only direct labor involved in production), hosting, and software.
9. Average Gross Margin (AGM)
Gross Margin = (Revenue – COGS) / Revenue
A company’s Gross Profit is stated as a dollar amount (or local currency), while gross margin is stated as a percentage. But both effectively represent the same thing.
Metrics measured in percentages are easier to comprehend and communicate. For instance, it’s more palatable to drop the goal to increase AGM from 70% to 75% rather than telling the team how much money the product should make.
10. Gross Margin Per Lifespan (GML)
GML = Average Gross Margin (%) × Customer Value
Gross Margin Per Lifespan represents the expected profit over the average customer lifespan.
You can compare this metric against customer-related expenses, such as customer acquisition cost, to see if your spending is justified. If not, you can try to lower your CAC, increase your GML, or manage a combination of both.
11. Net Profit
Net Profit = Gross Profit – Operating Expenses
Net Profit describes whether the business is profitable overall. This metric accounts for all expenses: rent, taxes, contractors, employee benefits, etc. As a result, you see how much money your business has “earned.”
Gross Profit is not an adequate measure of profitability because it doesn’t take into account your spending outside of development and maintenance. That also explains why the Net Profit metric is lower. If your Net Profit is much lower, consider cutting down non-essentials; for example, downsize your office and transition to hybrid work.
12. Conversion Rate

Conversion Rate = Total Number of Conversions / Total Number of Unique Visitors × 100
Conversion Rate shows the percentage of users that become paying customers. Obviously, the higher, the better.
Alternative to the formula above, you can divide the number of conversions by the number of leads or sessions. The calculation ultimately depends on what you consider as your conversion event and how you measure traffic. The numerator stays the same and measures your conversions, and the denominator is your total pool of traffic.
For example, you can track how many trial users subscribe to the paid plan. And you can set a percentage goal to, let’s say, 5% (common for early-stage SaaS companies).
13. Retention Rate
Retention Rate = Number of Users at the End of the Tracking Period / Number of Users at the Start of the Tracking Period × 100
You can also call it the renewal rate since many SaaS companies rely on customers who renew their subscriptions.
A growing retention rate means more customers are getting value out of your product or service. A decrease in renewals means your customers aren’t completely satisfied or your product has a short lifespan.
The retention rate sheds light on buying patterns across the subscription lifecycle and helps you understand seasonality better.
14. Churn Rate
Churn Rate = Lost Customers / Total Customers at the Start of the Tracking Period × 100
You can also divide it further into:
- Gross Churn Rate, which represents the rate at which SaaS customers cancel their subscriptions. This metric is commonly accepted as the default when discussing SaaS Churn.
- Net Churn Rate, which shows the change in recurring revenue due to expansions, cancellations, and downgrades.
Overall, the Churn Rate is the opposite of retention. Instead of telling you the percentage of users who signed up and stayed with you, it tells the percentage of those who signed up and then left within a given amount of time.
When making projections for the future, consider the Churn Rate as the probability.
15. Discount Rate
The Discount Rate determines the present value of your future cash flows. In other words, it tells you how much profit the business is expected to gain, considering its risk profile. A higher rate implies more risk and more potential.
Keep in mind that the expenses of SaaS companies are heavily frontloaded by the substantial costs of research and development (building, testing, and rebuilding their products). This ultimately boils down to the idea that SaaS businesses spend most of their money in the beginning stages and reap benefits later.
When you start scaling up, investors will want to know this KPI to gauge the minimum return expected to be earned.
16. Customer Acquisition Cost (CAC)
Customer Acquisition Cost = Total Marketing and Sales Expenses / Number of New Customers
It’s about time to talk about CAC, one of the most important metrics for any growing company. Put simply; it measures how much your company spends to convince users to buy your product.
It may take a lot of effort and funds to win over customers: SEO marketing, social media marketing, Google Ads, giveaways, and affiliates. Total Marketing and Sales Expenses also include personnel spend and technical costs (like CRM software).
There is no industry standard for the overhead cost of acquiring a new customer. These decisions are made internally, taking into account the price of the product, the number of existing customers, revenue, and the expected growth of the brand.
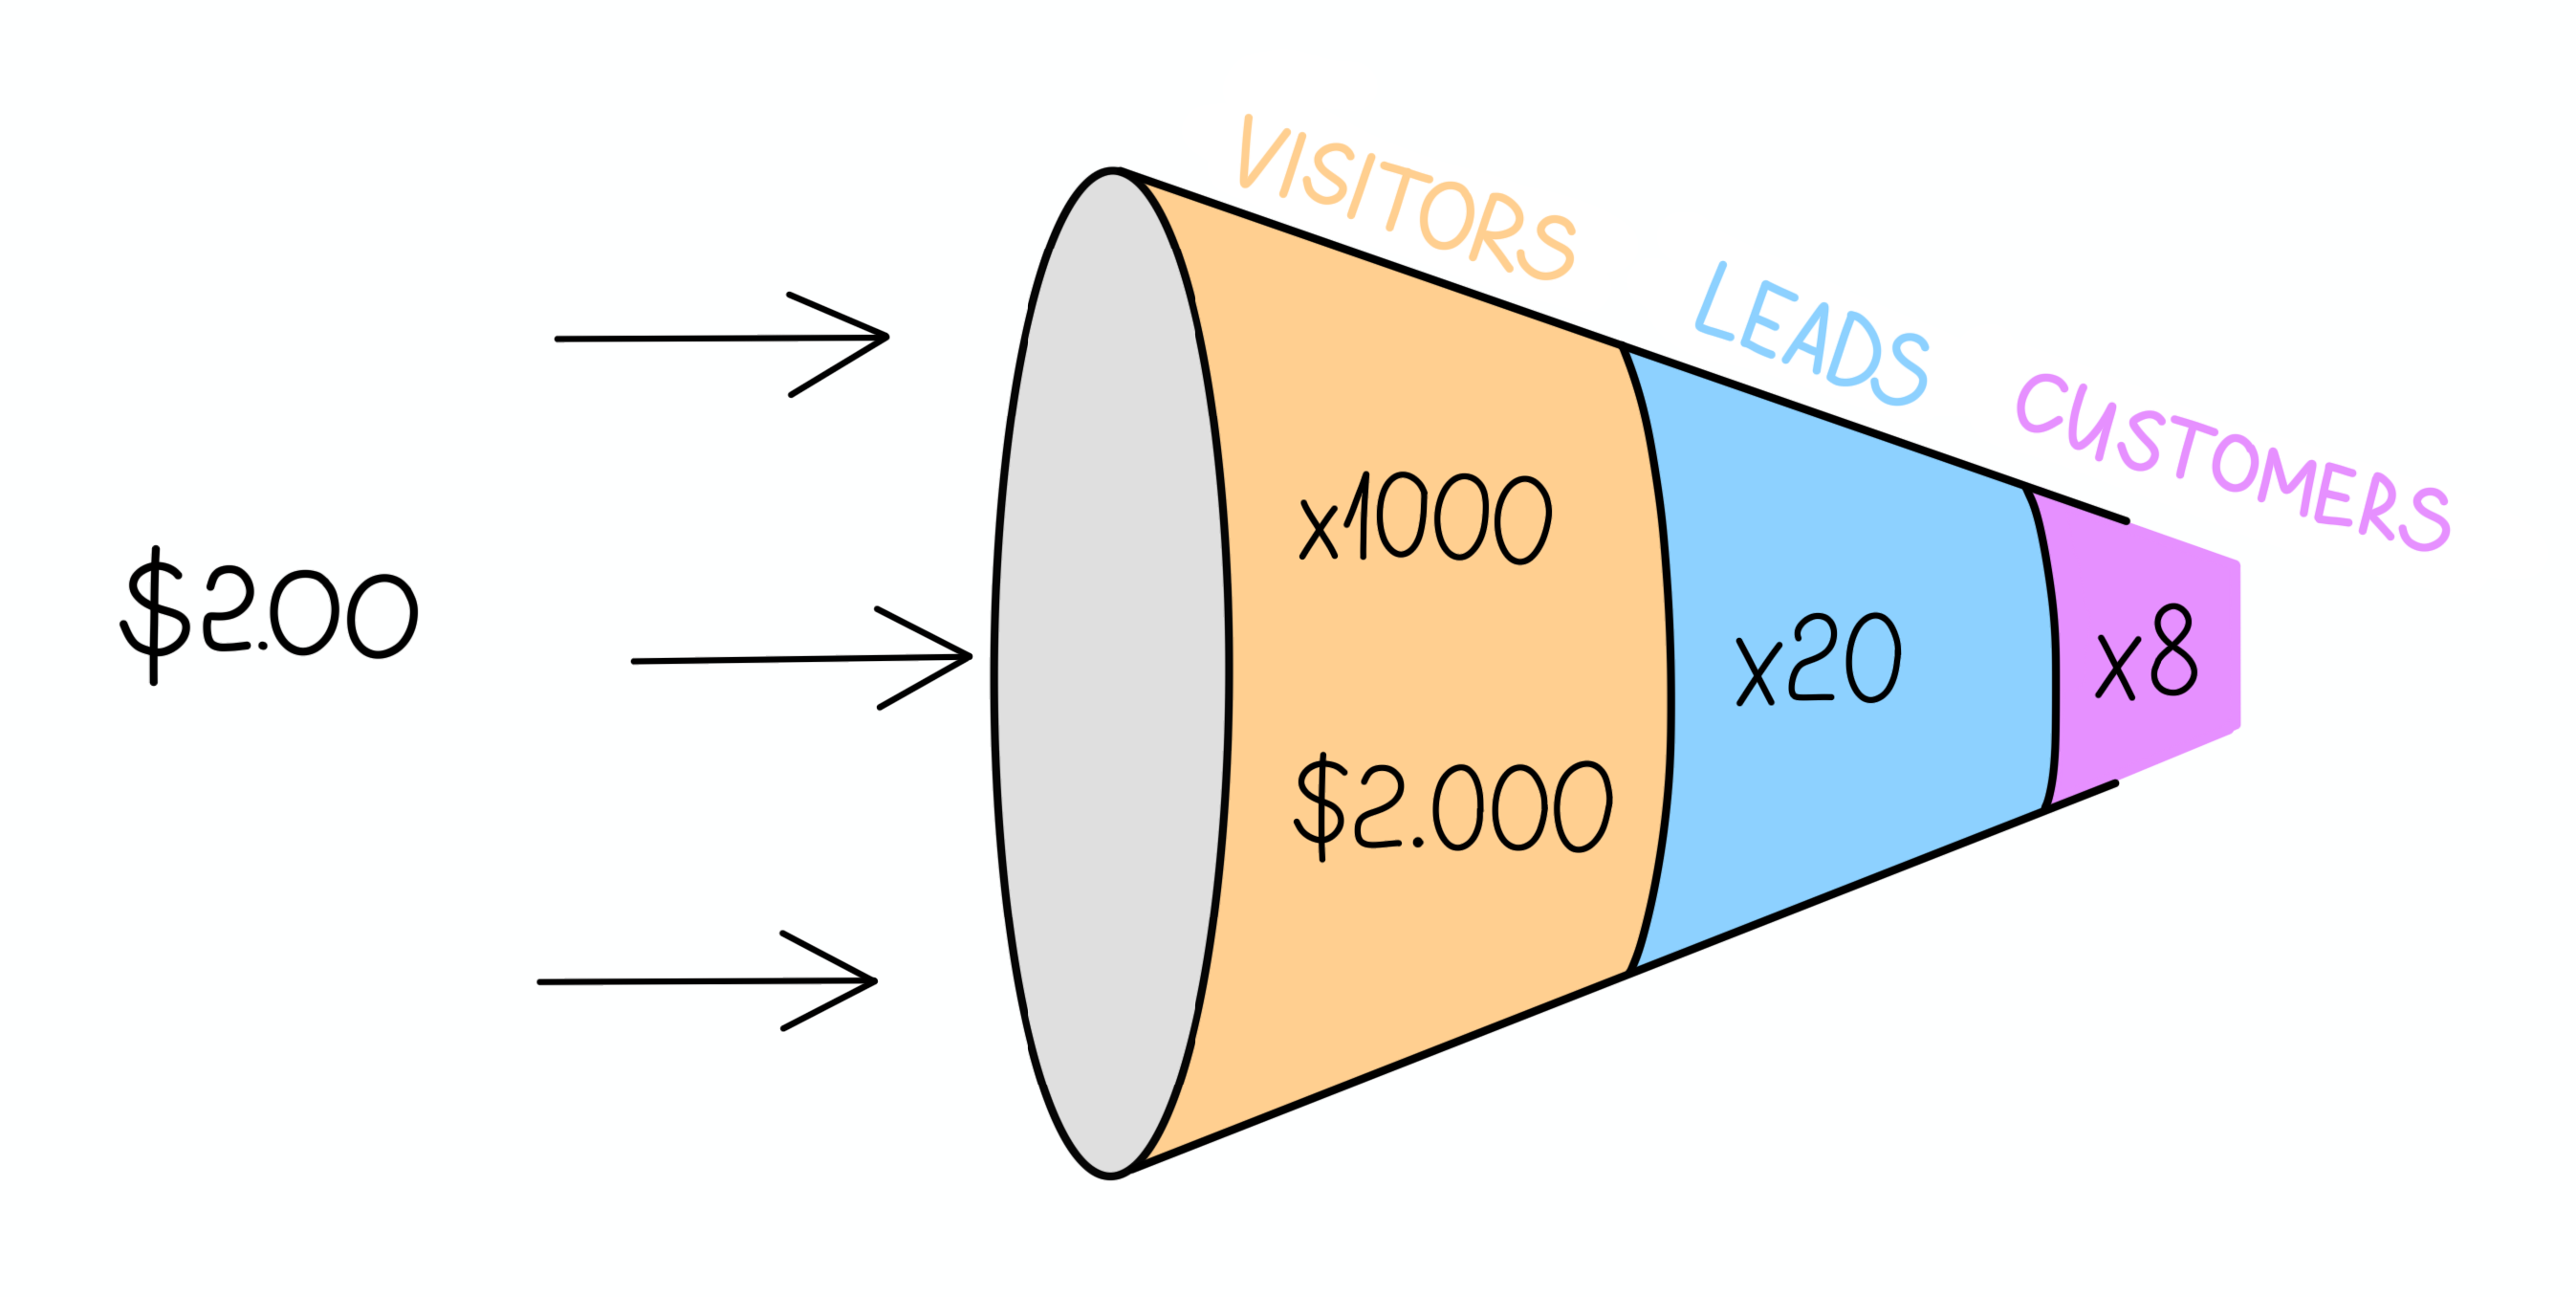
17. Cost Per Lead (CPL)
Cost Per Lead = Total Ad Spend / Total Attributed Risk
In a similar vein, Cost Per Lead measures the average amount you spend to acquire one new lead or prospect. Leads are a step away from sales. They might not be ready to subscribe now, but they are already interested in the product, so they could pay for the solution (i.e., convert) sometime in the future.
It’s up to your marketing team to decide what qualifies as a lead. It may be people who downloaded the app, signed up for a free trial, or subscribed to the email newsletter.
Leads and customers are usually acquired during the same marketing campaigns, which means costs may overlap.
18. Cost Per Mille (CPM)
Cost Per Mille = Total Amount Spent Total / Total Measured Impressions × 1,000
CPM is not as grand or critical as CAC or CPL, but keep your eye on it, nevertheless.
The term Cost Per Mile describes the cost of 1,000 ad impressions on an advertiser’s platform and helps determine the effectiveness of ads. If you’re not sure what impressions mean, it’s digital views or the number of times an ad was loaded on a page.
The more impressions, the more users have seen your product. And the lower your CPM, the more campaigns you can afford to run for those 1,000 new user impressions.
19. Return on Investment (ROI)

Return on Marketing Investment = Net Return on Investment / Cost of Investment × 100
ROI is a measurable and concrete business goal. At first, you want to recoup the resources put into building and improving the product. That would mean aiming for 100% ROI. If $10k were invested into the company, you want the profit to at least cover them.
The next point to aim at would be ROI over 100% and to infinity. That would mean the company is making more money than the founders and investors spent on it (or continue spending on it).
20. Return on Marketing Investment (ROMI)
Return on Marketing Investment = (Profit Attributable to Marketing – Marketing costs) / Marketing Costs × 100
Return on Marketing Investment compares the gain or loss from an investment against its cost. You can also track ROI from CAC:
ROI = (Profit Attributable to Customer Acquisition Costs – CAC) / CAC × 100
In both cases, you’ll be measuring the effectiveness of your promotional campaigns, just with different points of focus. Again, keep track of everything that counts as a “marketing cost”: sales and marketing salaries, content creation, ads, software, and equipment.
In Closing
Peter Drucker, “the father of management thinking,” noted that what gets measured gets improved. The trick is to determine the right things to measure and then make sense of it all to inform decisions. SaaS businesses are no exception.
Here are a few honorable SaaS KPI mentions that didn’t make the list:
- Activation Rate
- Net Promoter Score (NPS)
- Customer Satisfaction Score
- Customer Health Score
- Average Sessions Per Day
- Depth of Usage
Consider using automation tools for measuring performance and generating and storing reports. As much as you want to be in the know about new customers and new sales, you also need your team to spend more time improving the product than measuring it.

We convert raw data into meanigful insights for you to make the best decisions.
Featured Articles
-

Top 5 Data Visualization Tools in 2023
A simplified representation of complex data is key for any data-driven business. Raw data must be turned into a cohesively formatted visual that is…
Read more -

SnowFlake: The Best Data Warehousing and Prescriptive Analytics Solution
Data Warehouse as a Service, or DWaaS, has gained much popularity in the past decade. It is a service primarily provided by Snowflake Inc,…
Read more -

Simple Mobile Analytical Stack: Firebase + BigQuery
Developing reliable and high-quality mobile and web applications requires a lot of dedication and, more importantly, a powerful and feature-rich development platform. Firebase, provided…
Read more