Setting Up Data Engineering Processes and Looker Tables for Improved Data Pipelines and Telephony Insights for Aircall

Eyas K
Aircall Product Manager
Goal
- The Client was looking for top-tier professionals in the data engineering field with a deep understanding of cloud providers and cloud databases to build a customized data pipeline.
- Since the Client didn’t have in-house expertise, they looked for a remote expert with vast hands-on cloud data stack expertise. They chose Valiotti because we have years of experience in setting up cloud databases and implementing data engineering solutions.
- The Client also wanted to have the raw data visualized in Looker to allow its customers to keep track of the telephony services provided to improve the end-user customer experience.
Results
- Mapping out and implementing the data pipeline
We studied the Client’s sector, in this case, telephony. We interviewed key employees to obtain raw data storage parameters and investigated the Client’s cloud environment in which its AWS environment and S3 Data Lake Structures are hosted.
As a result, the raw data from the AWS S3 bucket was converted into an Amazon Redshift database. We tuned AWS Glue to work with S3 Datalake and built a data pipeline on Python and AWS Glue to transform the data into Redshift. Then, the data was sent to Looker, which was selected as a BI tool.
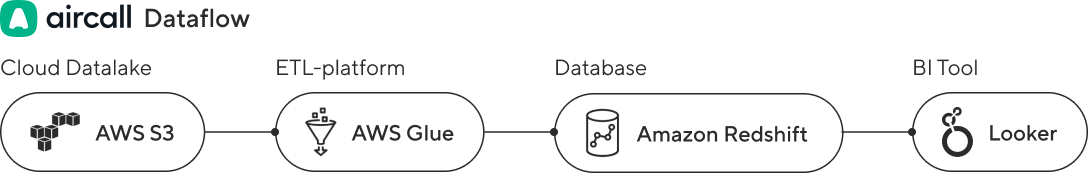
To build a pipeline to convert raw data from the S3 bucket into the Amazon Redshift database, we came up with the following data transformation structure:

- Building a LookML model for the Redshift data model
To enable real-time inbound analytics in Looker and build tables, we set up SQL Runner for the RedShift data model.

This allows Aircall customers to access flexible dashboards in Looker that cover the following data:
- The number of missed calls of those abandoned by a caller or unanswered by an agent. The data also includes reasons for a missed call (an agent wasn’t available or merely didn’t answer) and when a customer abandoned the call (during the welcome message, IVR, or waiting time). This allows Aircall to better investigate the incidents and come up with initiatives to reduce the number of missed calls.
- The scope of missed calls by day or hour.
- The total number of missed calls
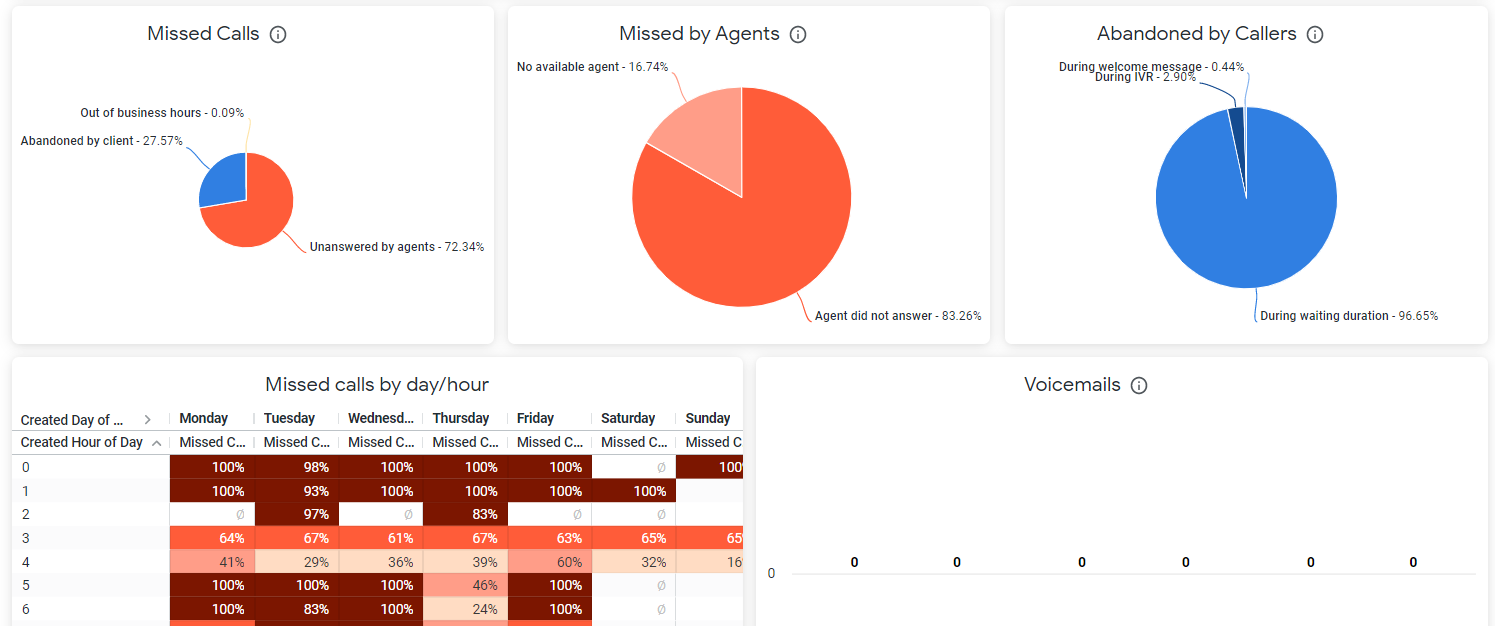
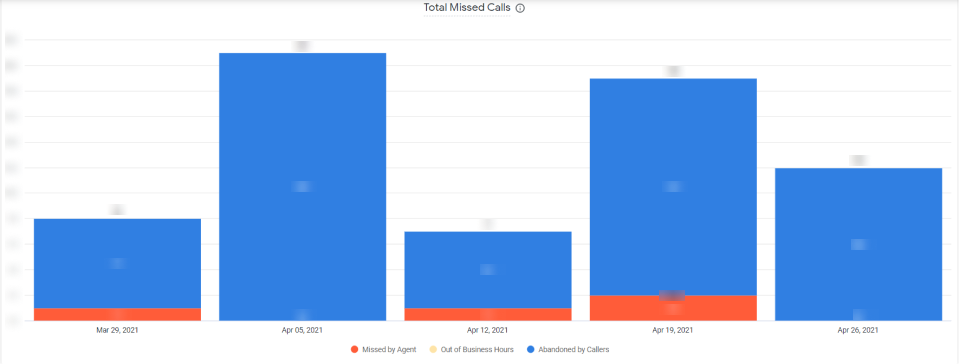
The view of the Looker dashboards is customizable and can be adjusted according to the Client’s preference or needs.
Tips
- Understand the Client’s domain and dive into details to build a data pipeline with the business objectives and specifics in mind.
- Set up all environments (test/stage/dev/prod) for the project during the initial stages.
- Get familiar with the required stack of tools, AWS Glue in this case, for enhanced performance and a faster delivery time.
Learn How Data Insights Can Benefit Your Business
Wondering what value data insights can bring your business? Get in touch, and we'll answer your questions!
Other Case Studies


