SkyCoach Case: Non-expert In-House Team Receives and Acts upon Professional Guidance to Establish Monitoring of Product Insights
Goal
SkyCoach aimed to get product-related insights to improve their service. Therefore, they needed to set up a system of product-focused reports in Power BI to monitor metrics dynamics by weeks/months/quarters/years, as well as by different games. Currently, they provide services for over 20 online games.
As they lacked an in-house data analytics team, they needed a reliable partner to set up analytical infrastructure. The partner also needed to provide guidance after the project’s completion so that the in-house team could work with the reports on their own.
Results
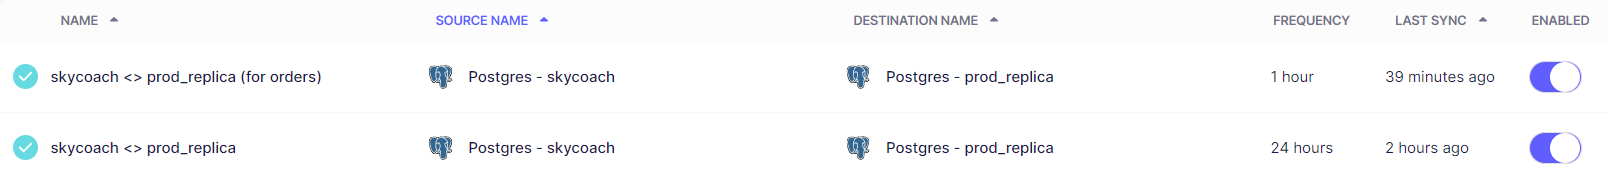
- Setting up Airbyte on a remote server for data integration
The Valiotti team set up Airbyte—a data integration platform—on a remote server to establish a connection between two databases:
- Source is the prod database to copy the data from
- Destination is the final database that includes the tables for reports
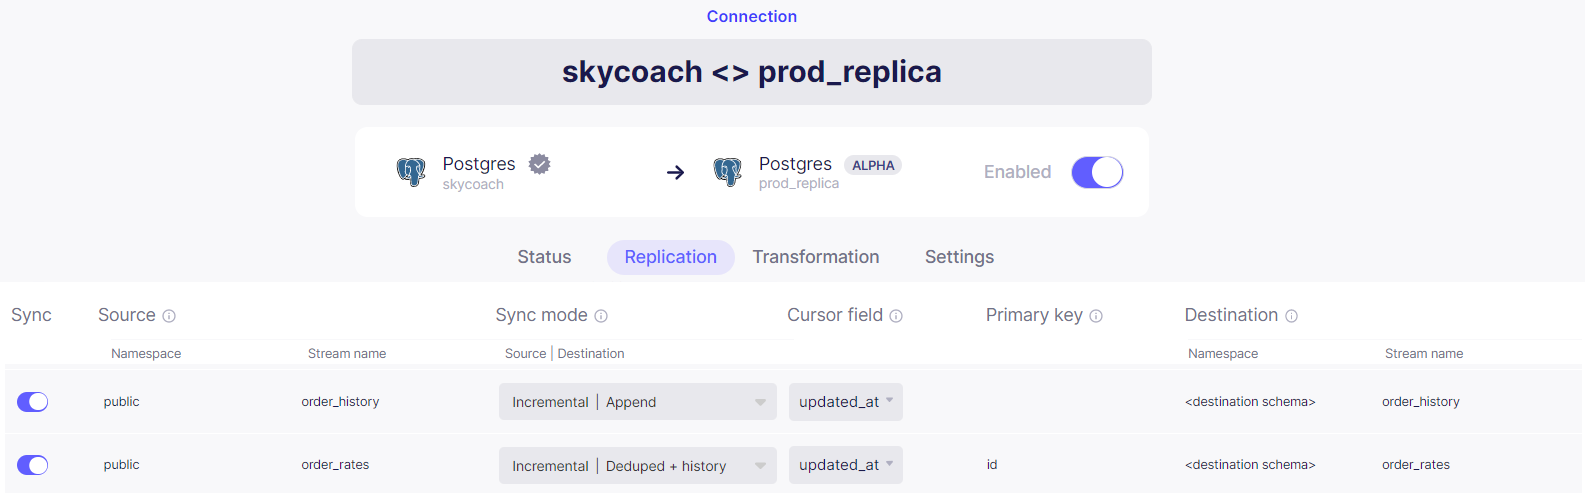
To complete the task, our team examined the source database, chose tables to write SQL requests, and set up the frequency of tables, which was updated according to the Client’s business needs. Later, SQL requests were written.
- Building data-rich reports for enhanced monitoring and data-driven decision-making
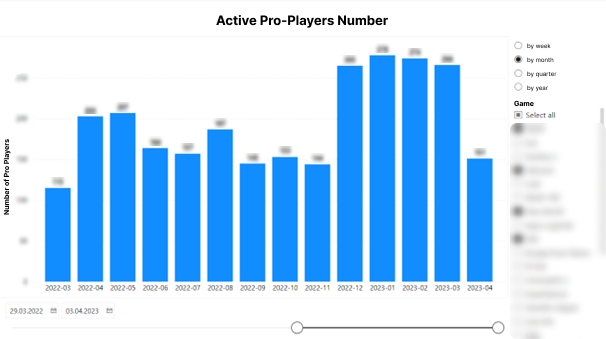
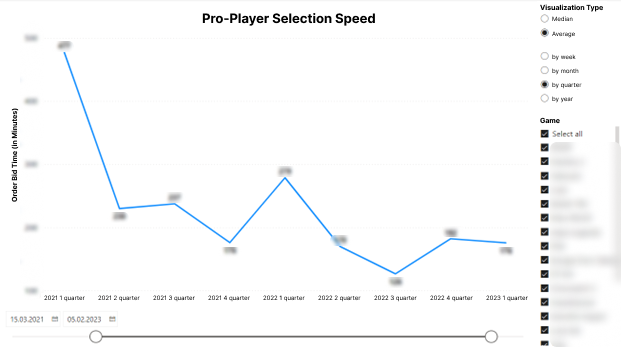
Analyzed the Client’s request and needs, we provided future-report drafts, with key visualization types and data to be analyzed. After refining the draft, we created Power BI reports. The Client received the following reports:
- The number of active pro gamers by week/month/quarter/year and by game to get a better understanding of specific-service demand
- The speed of pro-player selection by timespan and game to determine pain points and improve them
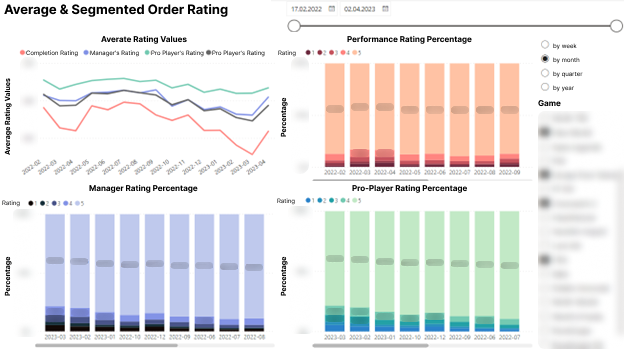
- A comprehensive overview of ratings by managers, pro gamers, and users, with average figures, to analyze the quality of the provided service by game
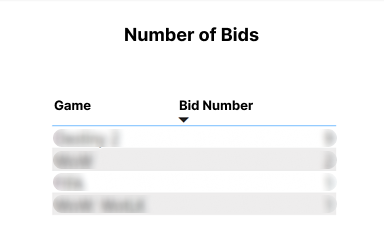
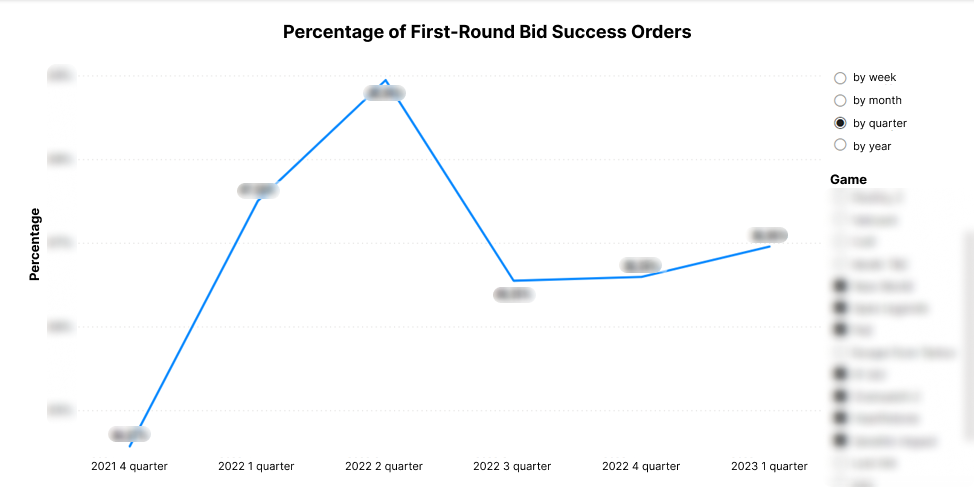
- Auction insights, including the percentage of orders accepted on the first try, how long an order was at the auction stage, and the number of orders in an auction

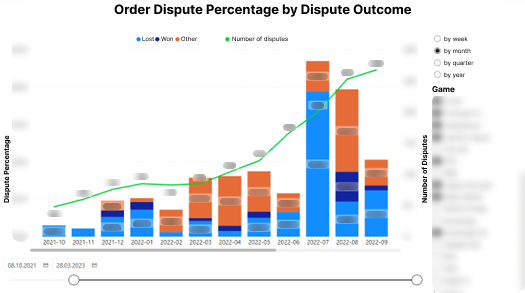
- Dispute percentage of all orders in terms of different dispute outcomes: lost, won, and others. They are also analyzed by game and timespan to allow the Client to understand bottlenecks and improve the service to minimize the number of disputes.
- The percentage of refunds of all orders by the type of refund: full and partial refunds

At the final stage, we provided extensive documentation for the Client to be able to carry out analytical processes themselves.
Tips
- Always ask for comprehensive documentation if you plan to maintain data analytics on your own. We always work closely with our clients’ teams that seek expert guidance to provide them with all the necessary tools and knowledge for efficient data analytics.
- Consider Airbyte for data replication, as it offers a wide set of connectors, simple architecture, and various strategies for data synchronization. What’s more, it doesn’t require coding for replication.
Learn How Data Insights Can Benefit Your Business
Wondering what value data insights can bring your business? Get in touch, and we'll answer your questions!
Other Case Studies


